| Getting Started |
| Frequently Asked Questions |
| Advanced Functions |
| Troubleshooting |
| Hints & Tips |
|
Getting Started
1. Views
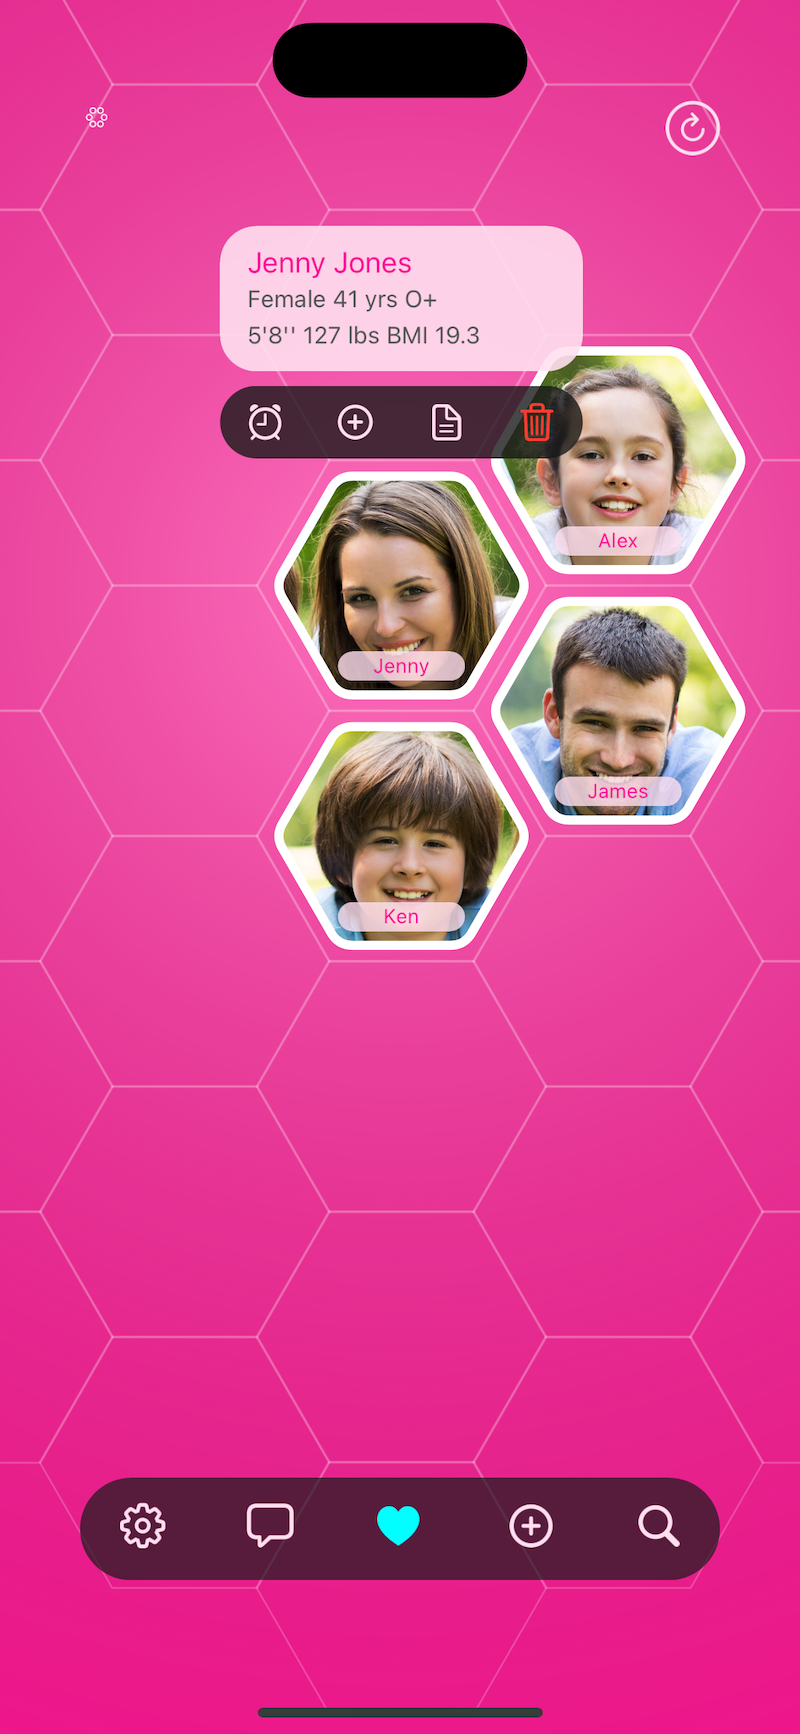
Main view consists of tile view of recently accessed profile and icons to access major functions. Icons- Search: search icon on the top left allows you to search profiles by name.
- Add: plus icon on the top right will allow you to add a new profile/chart.
- Tile & List View: by using the icon on the bottom left you could toggle between list and tile view. List view shows all profiles, where as tile view shows one profile with more information. Scroll left/right to navigate tile view.
- Settings: gear icon on the right bottom opens up Settings menu with more options.
- Notifications: message bubble icon (bottom, second from left) will show all alerts and notifications. Icon will change color (or flash) when messages exist.
- Feedback: heart icon (bottom, second from right) offers communication options such as send Feedback or report a problem to us.
Tile ViewFrom tile view without opening a chart you could do the following actions. - clock icon - view/update medication reminders
- report icon - view/share summary report
- star icon - change relationship
- trash icon - delete a profile
2. Basic Setup
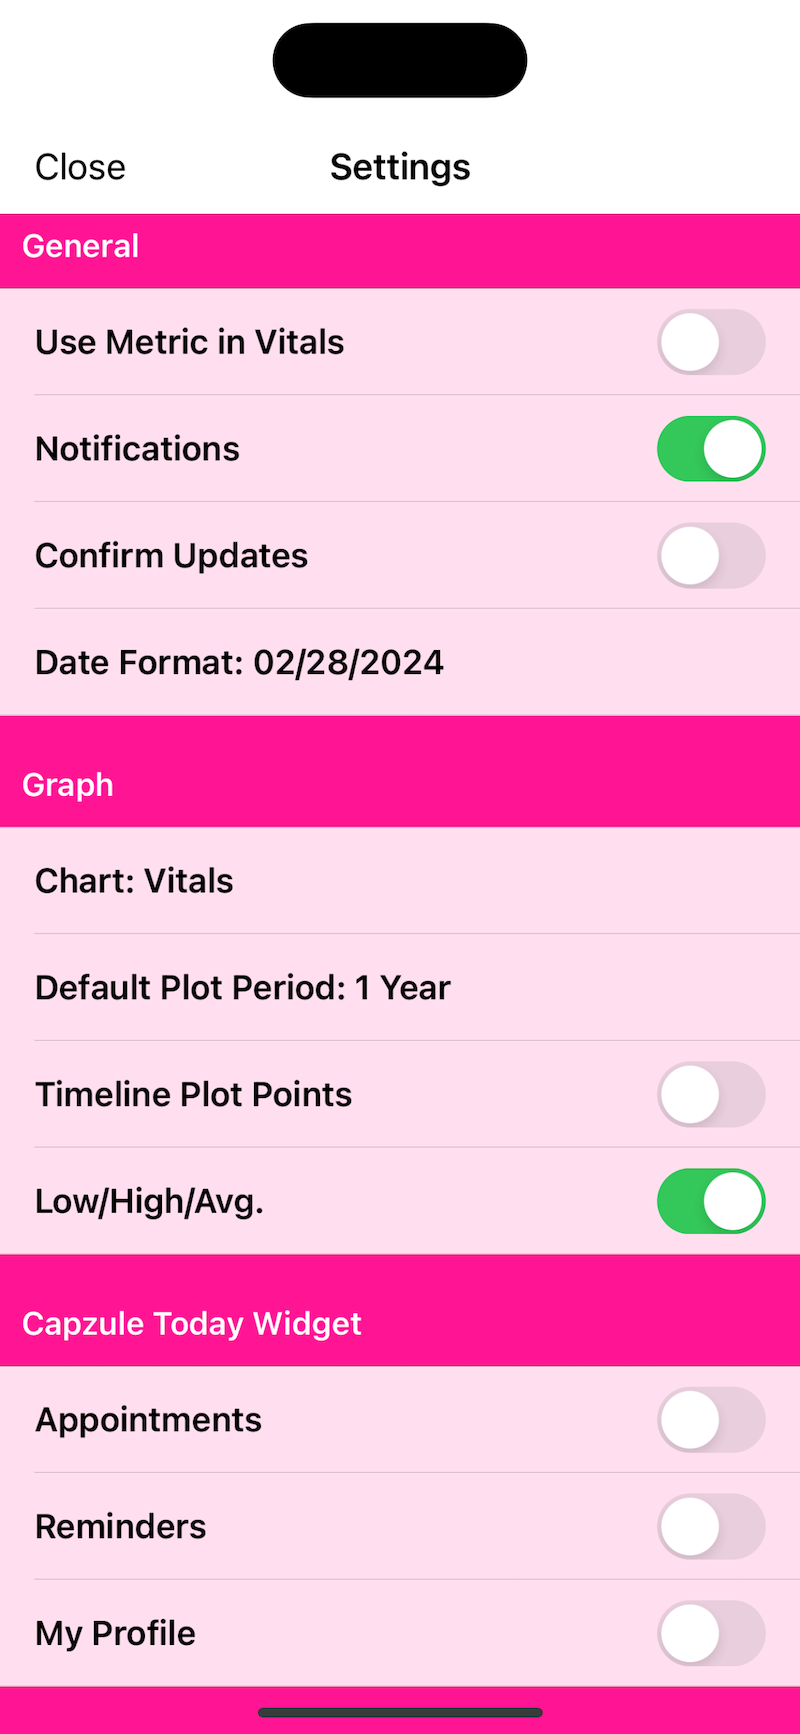
Set Metrics:Metric is the default weights and measurements in your app. When the apostrophe and quote are used to signify feet and inches (such as 5'7") or lb (such as 140lb) for pounds while the Metric is ON, the app will convert to cm and kg. To switch to US Standard Measurements: Go to Settings
Move the slider marked "Use Metric in Vitals" to OFF
NOTE: When Metrics is changed in settings, previously entered data will be converted to the selected type of measurement.
3. Add New Member/Chart Profile
New Member/Chart: Select the plus icon to add a new member.
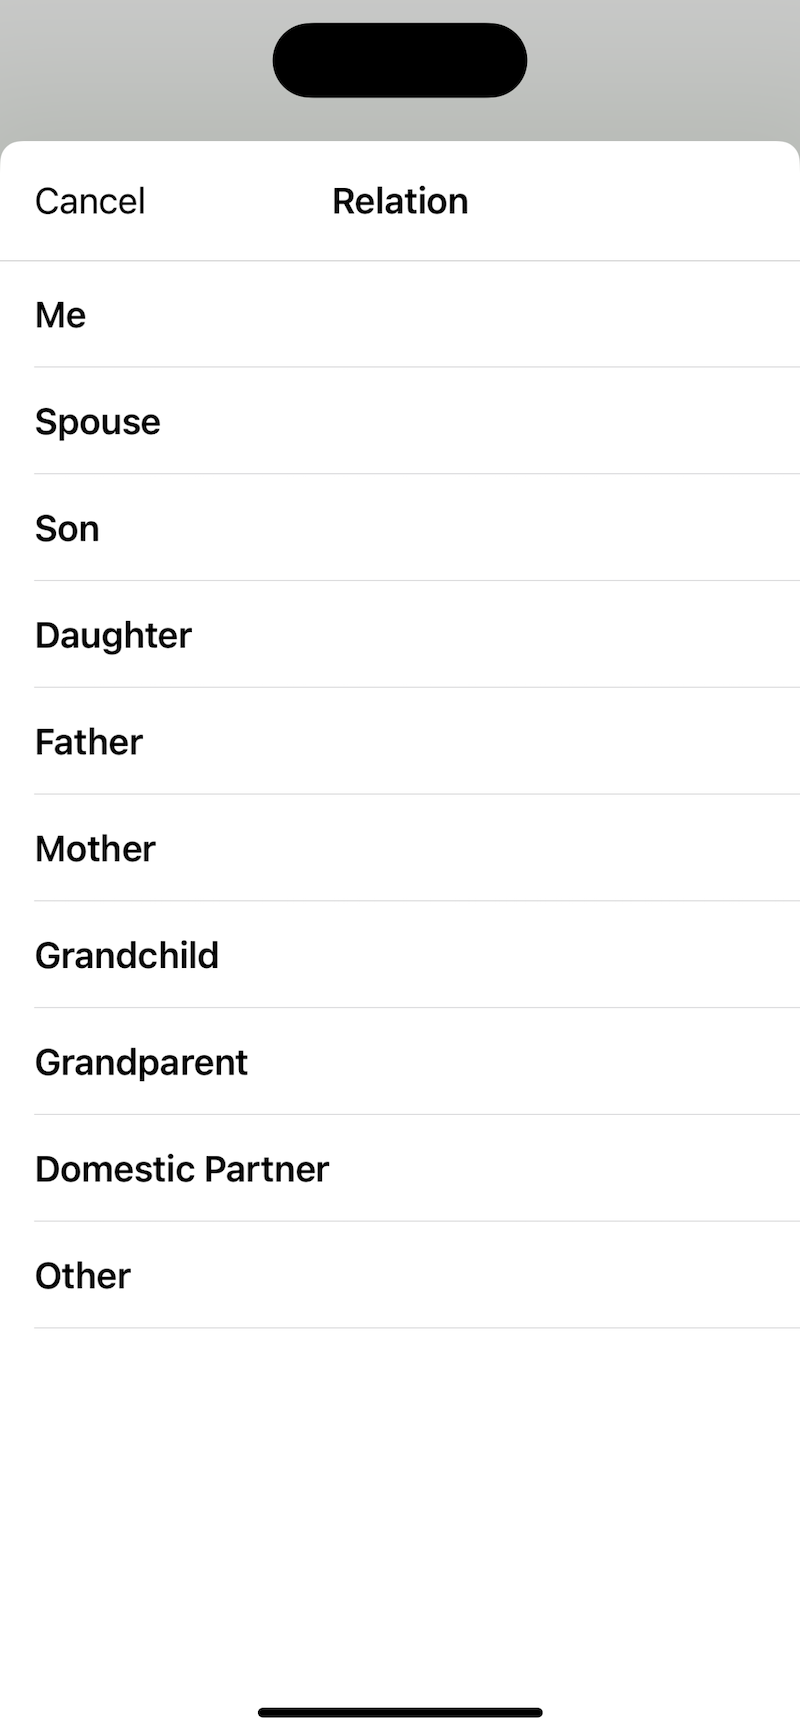
In the Relation section, select "Me" to identify yourself as the owner. This will show your information in the Profile menu (bottom left).
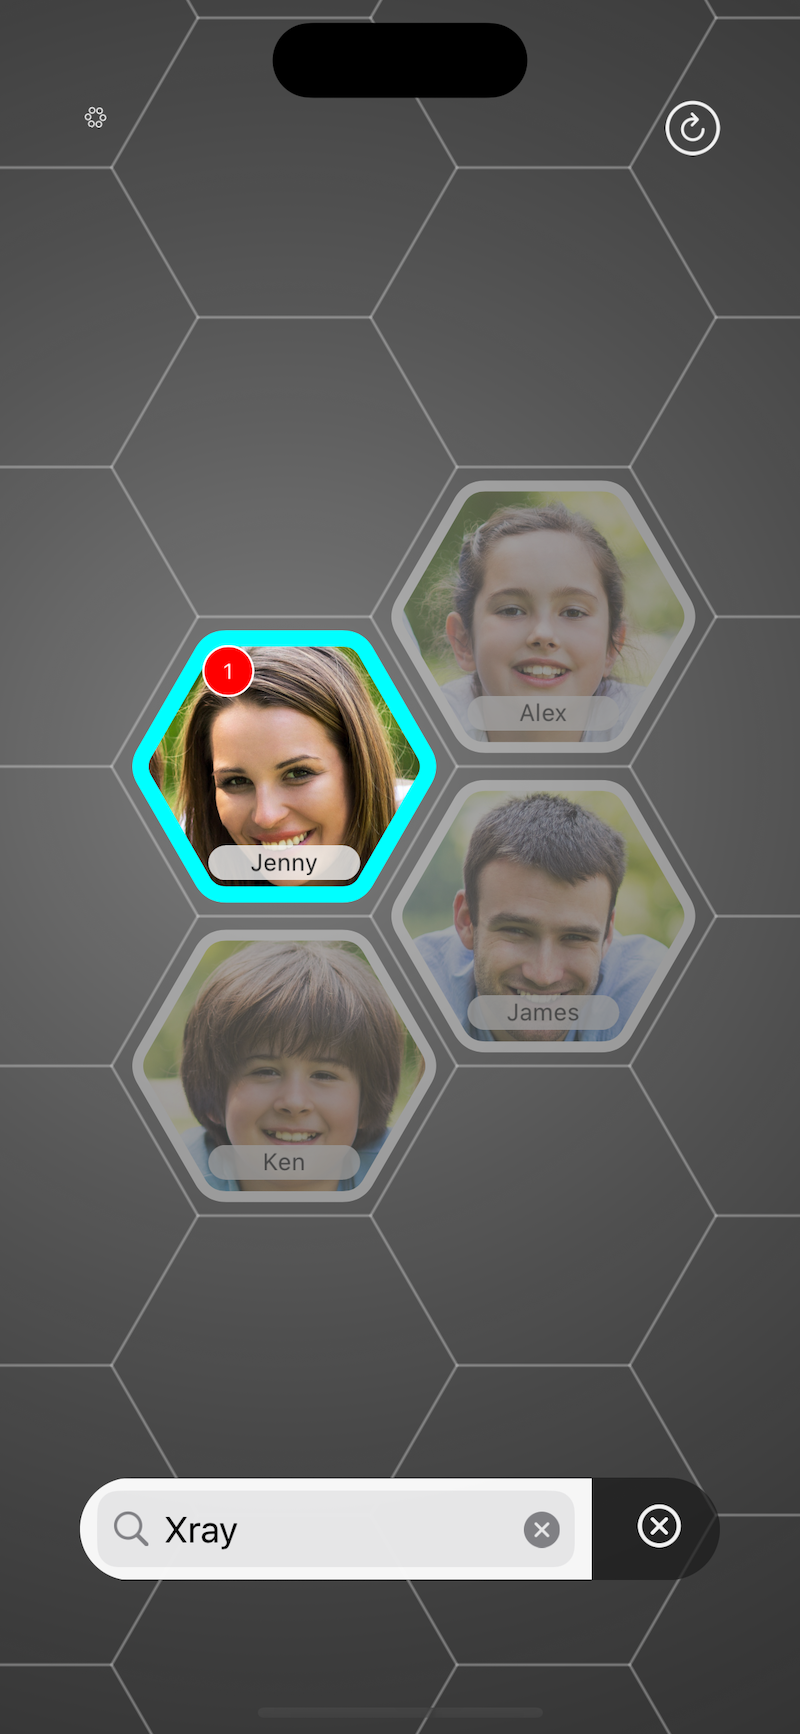
Search for a member/chart by selecting the spyglass in the upper left corner of the screen. Enter the beginning of the first or last name and select Search.
To return to the full listing, select the spyglass icon, remove the characters from the search box, and selct the spyglass icon again.
Enter Height & Weight into the Vitals Flow Sheet:
Select a Member/Chart from the Chart menu list.
Select the Graph tab from the list of tabs on the right.
Select the plus icon to the right of Vitals to open a new edit box.
Enter the information & select Save.
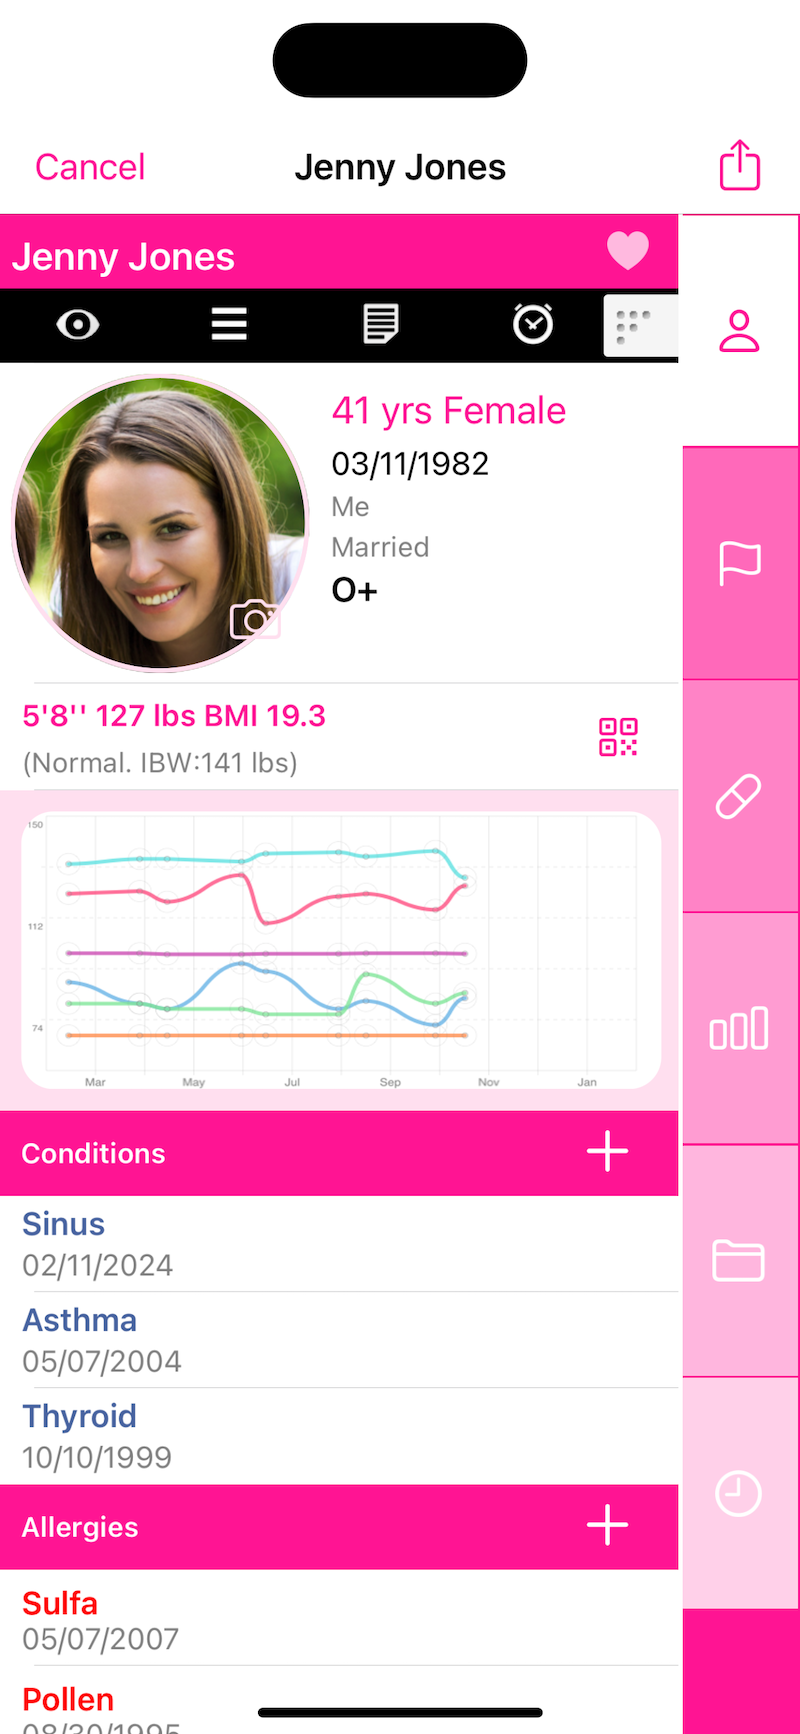
The Profile (top) tab will reflect Vitals data from the most recent date.
Blood Pressure is entered in Systolic/Diastolic format, for example 120/80.
BMI (Body Mass Index) will be automatically calculated based on the height and weight you enter.
4. Add, Edit & Update Information
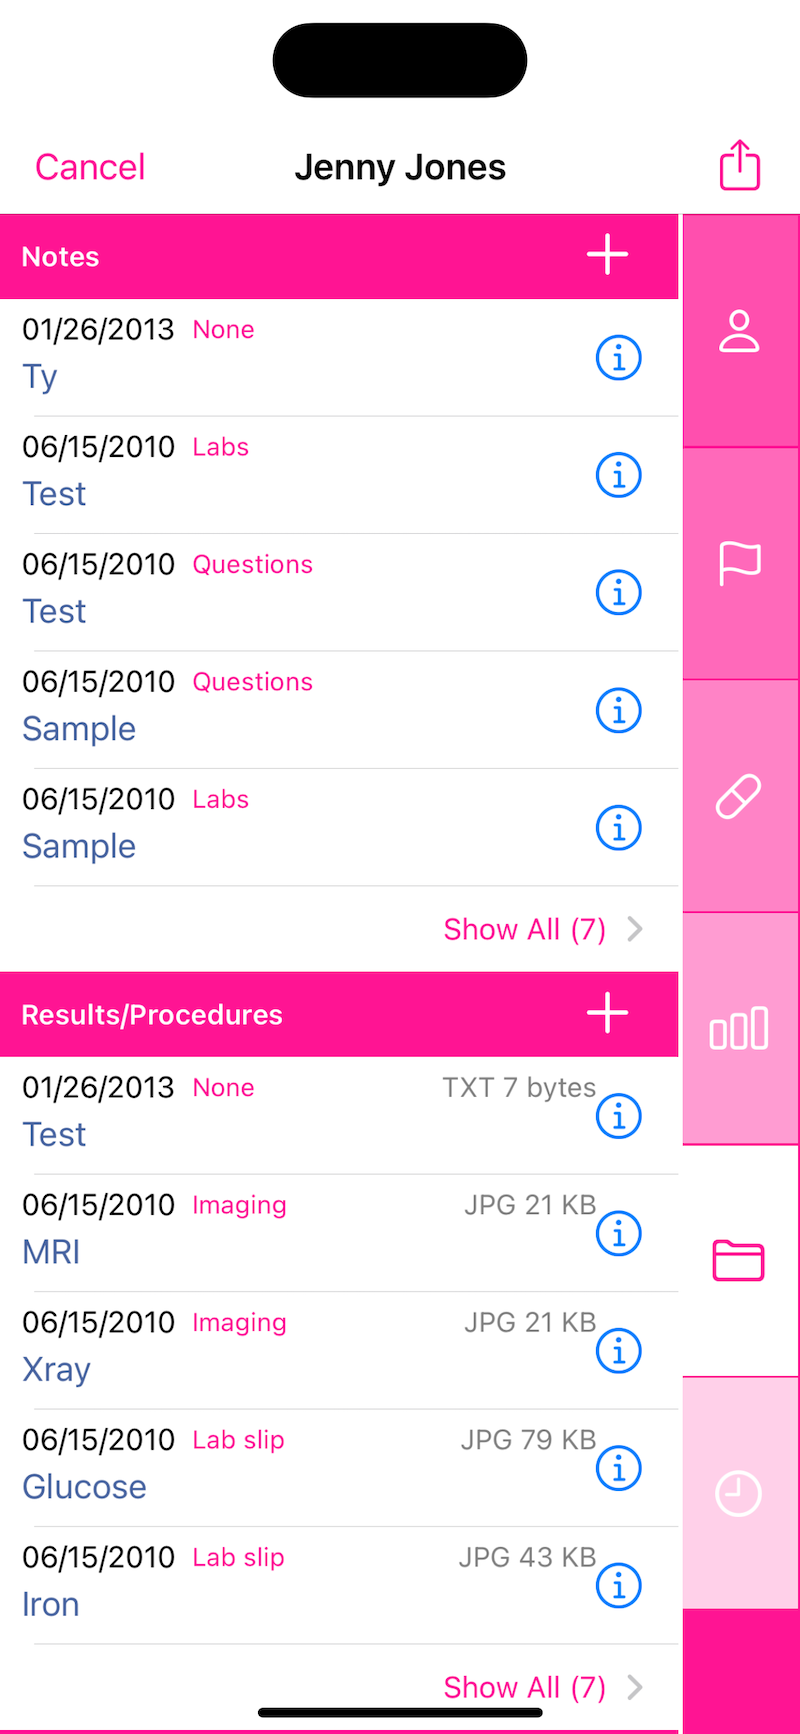
Create a new entry or update an entry:1. Select the plus icon next to a category to enter new data. 2. Select Save (this will create a line item listing below the category entered). 3. Select a line item listing to open data boxes in edit mode. 4. Enter/Edit information & select Update. Upload Documents & Images:1. When in the Folder tab, select the plus icon next to Results/Procedures or Attachments categories. 2. Browse/Search for the file, enter the required information, and select Save. 3. When "From Computer" is selected, a WiFi connection will be required. NOTE: To upload a file from email, see Insert/Upload Mail Attachments. For more information on uploading from your computer see Connect from Computer. Enter Flow Sheet Data:1. Select the Graph tab when viewing a member chart. 2. Select the plus icon to add a new entry for Vitals (data recorded from your doctor's office), Flowsheet (data related to lab tests), or Self Monitoring (data you track on your own). 3. Select the Type of flow sheet data to enter. 4. Fill in/edit the text boxes, and select Save/Update. NOTE: Non-numerical text will only show in the listing and summary, but will not be graphed. - Flow sheets are created in the Settings. For more information on creating/editing templates, see Creating Flow Sheets. Delete a Data Entry:1. Open a listing in edit mode. 2. Scroll to the bottom of the page. 3. Move the slider next to "Delete This Record" to ON; select Update to complete. Delete a member/chart profile:1. Select the arrow action button in the upper right corner when in a chart. 2. Select Delete from the pop up box. 3. Confirm the action by selecting Delete again in the pop up box, or stop the action by selecting Cancel.
5. View Data
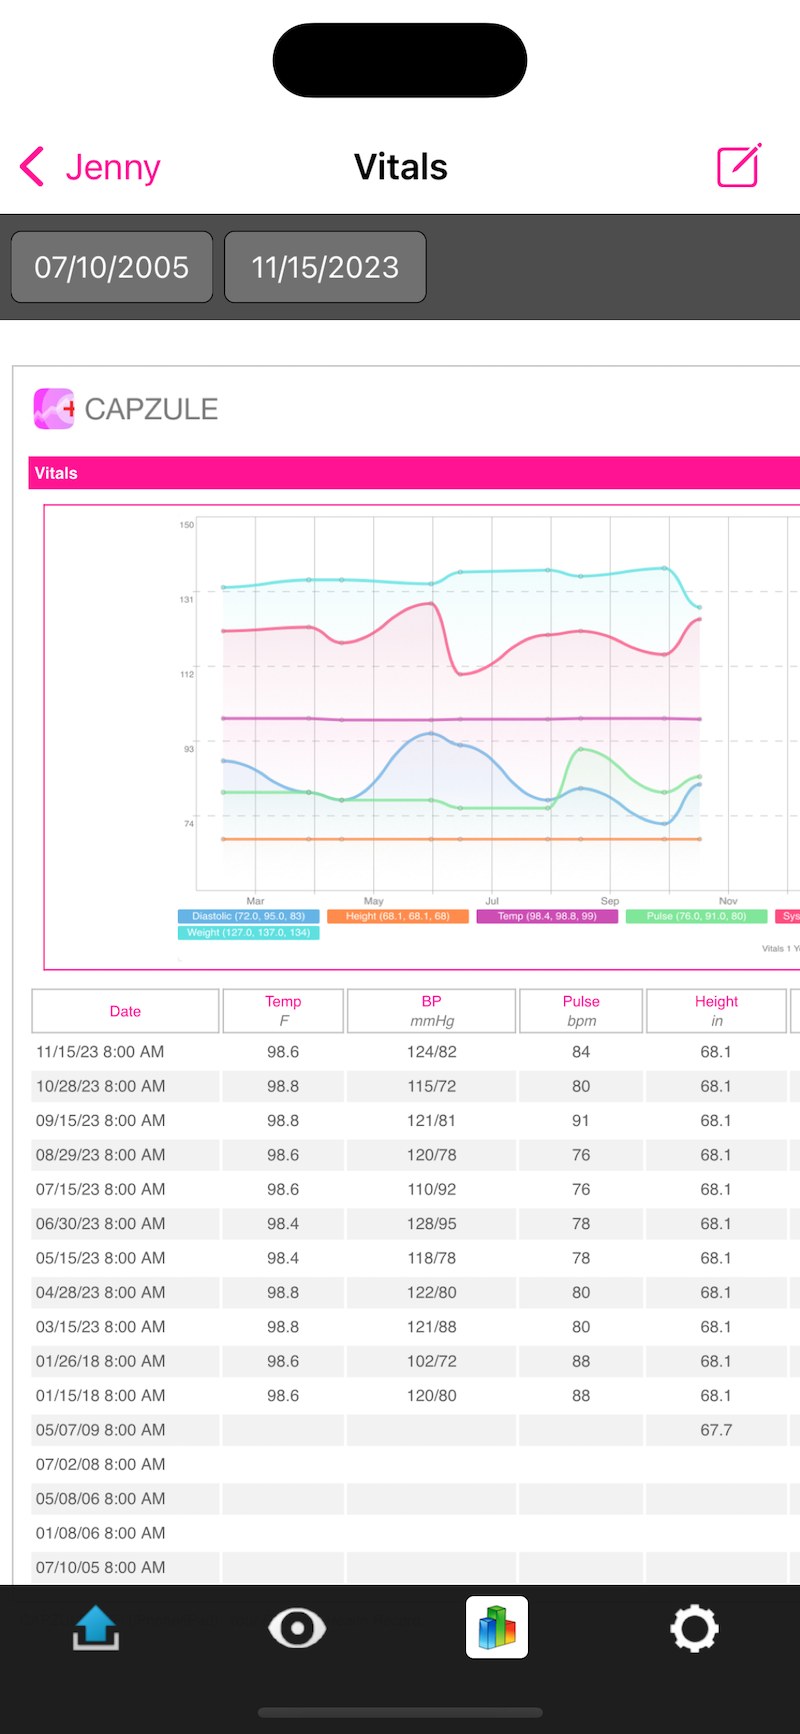
Flow Sheet Graph:1. Select the blue arrow button in line with a listing in the Graph tab. 2. Use the selections at the bottom of the page to change the time range of information, from one week up to 15 years. NOTE: To email data, see Advanced Functions: Email. - For additional graph views such as Timeline see Basic Buttons: Arrow Action ButtonImage or Document:1. Select the blue arrow button in line with a listing in the Folder tab. 2. Select the paper and pencil icon in the upper right corner to send the image/document in an email. For more options see Advanced Functions: Summary & Timeline
6. Set Preferences
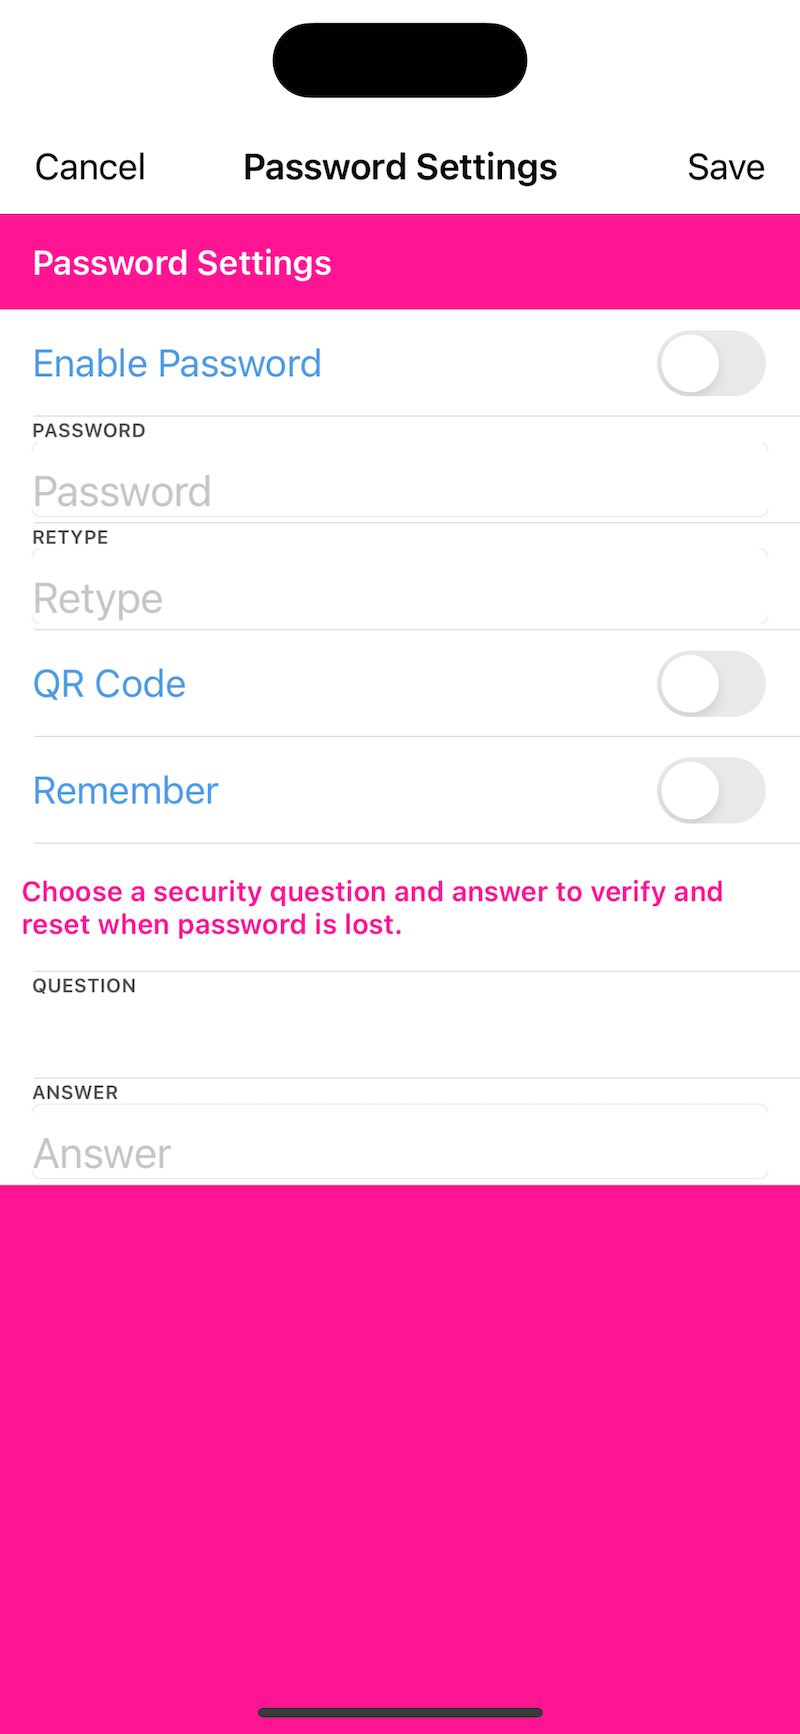
Password Settings:For security & privacy, create a password to log into your app: 1. Select Settings:Settings, then Password Settings. 2. Move the slider for "Enable Password" to ON. 3. Enter the password in boxes for Password and Retype. 4. Select and answer a security question - this is a secondary password that will appear should you forget the original. 5. Select Update NOTE: the option to Remember will allow the App to fill in the password text box when Capzule is activated. Change the Background Color:1. Select Settings: Settings 2. Scroll to the bottom for a list of colors to personalize your app.
7. Basic Chart Navigation & Buttons
Chart TabsThe Chart contains a set of tabs along the right margin to provide a quick resource to organize information: Profile: General information such as date of birth may be edited here, Conditions &
Immunizations: Record immunizations and vaccinations, record family health history, personal medical history, and social history.
Medications: Enter any prescribed medications and over the counter medications, vitamins, or herbs that your doctor should know about. For required fields that you are unsure of try using n/a or unknown.
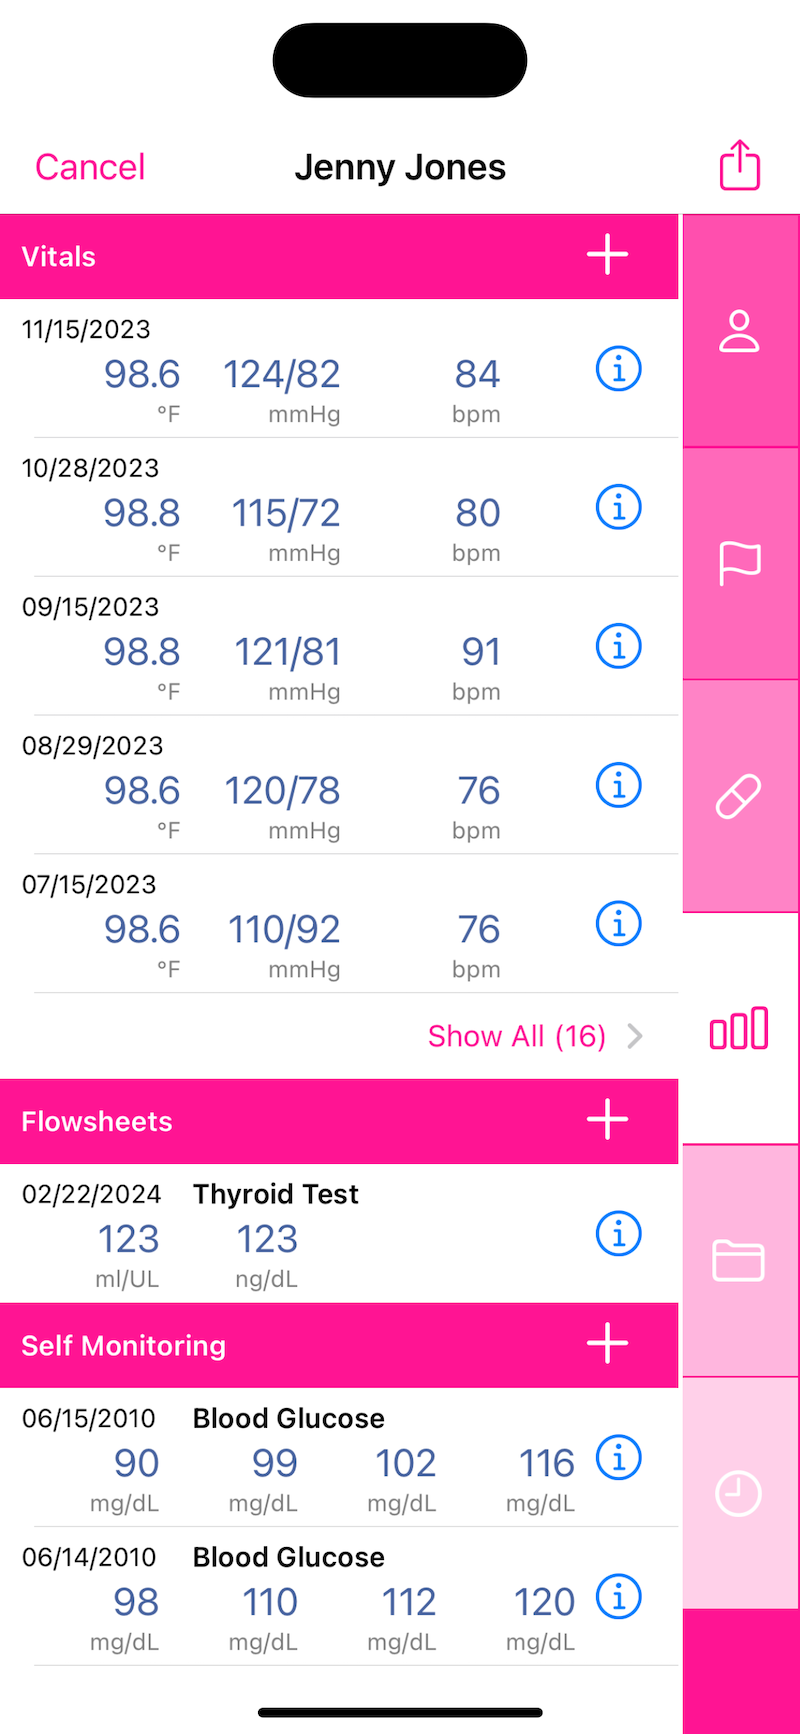
Vitals & Flowsheets: Record data over time & view it in a graph format. Preset flowsheets are provided; formatting may be edited, or new flow sheets created from the Settings menu.
Folder: Use the category field in each of these sections to help categorize & organize note entries and uploaded documents/images.
Appointments: Create an appointment on the agenda. "My Profile" will report appointments for all family members that are scheduled within the next 30 days. Set a reminder to call for the next appointment by creating a date 30 days before you need to see the doctor, and reminder in the notes section to "call to set up an appointment".
Arrow Action Button
This is located in the upper right corner of a member/chart profile, and provides a pop up menu of options for summary, timeline, and graph views along with an option to delete the chart.
Blue Arrow Disclosure Button
This will open an attached document or image to view when in the folder tab, or from the graph tab it will open a flow sheet graph.
Line Item
Select a line item/listing under a category to open an entry in edit mode.
Compose (Pen) Icon
This is available in the upper right corner when viewing uploaded images & documents, graphs, and summaries to allow you to send a copy from your iOS mail.
Plus Icon
This helps create a new entry.
Frequently Asked Questions
Can I organize similar files together in a folder?
By using Category in Notes, Attachments and Results/Procedures, you could arrange files of the same type together. Setting a CategoryType a short description in the category field of Notes, Attachments and Results/Procedures and save. For example, Surgeries, Radiology, Bills etc.
Viewing a Category
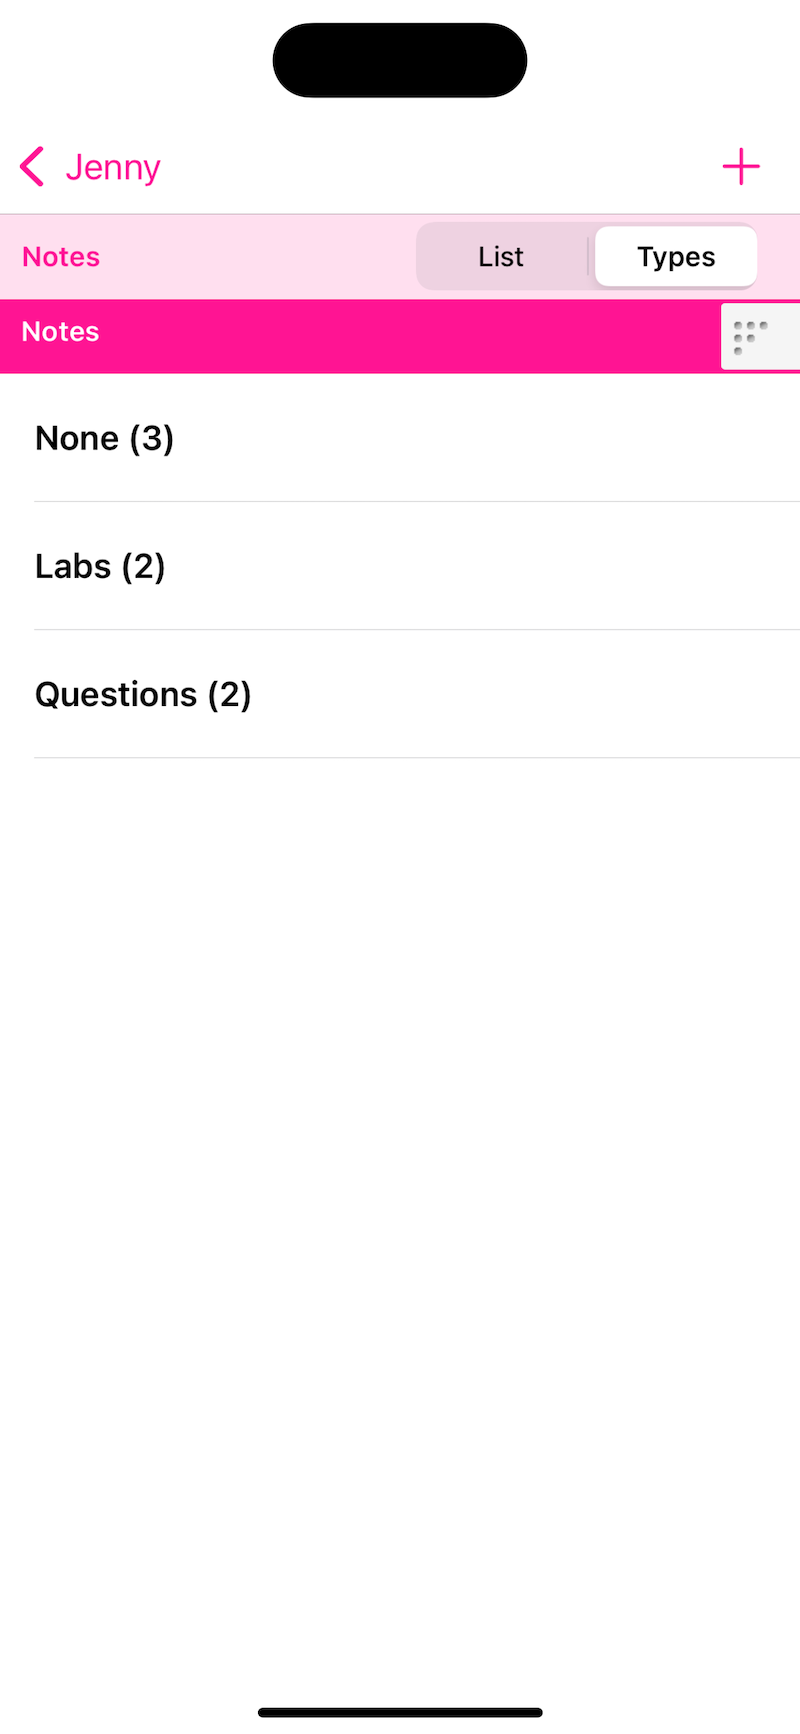
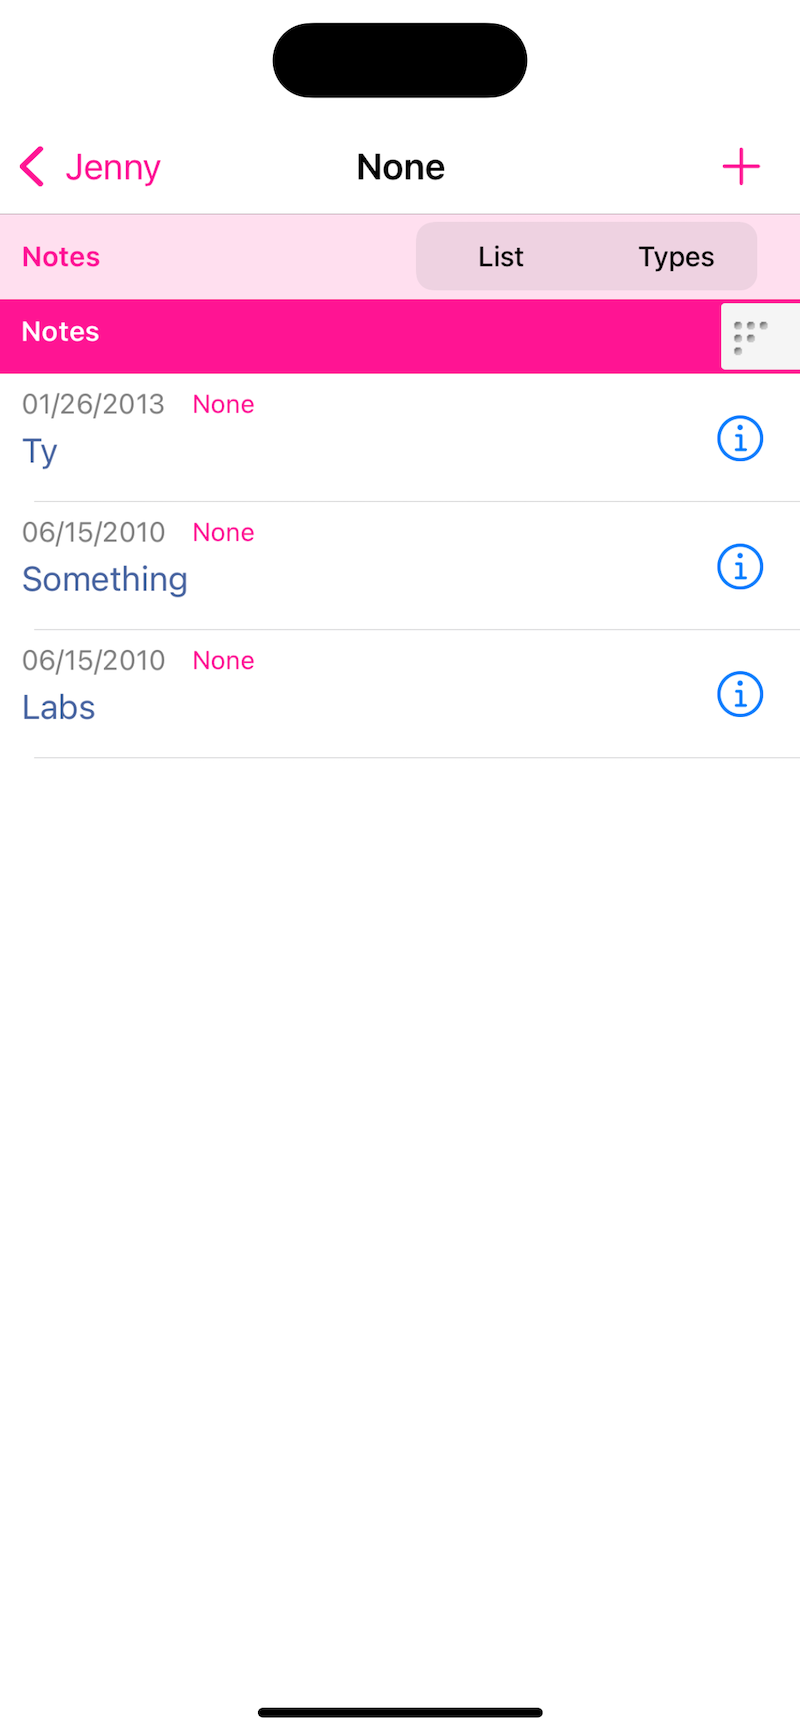
If you have more and 3 entries (5 for iPad) in a section, you will see Show All option below the last entry in that section.
select Show All of a particular section in Notes, Attachment or Results/Procedures
select Type from List / Type switch at the top right
select desired Category to view all files in a given category
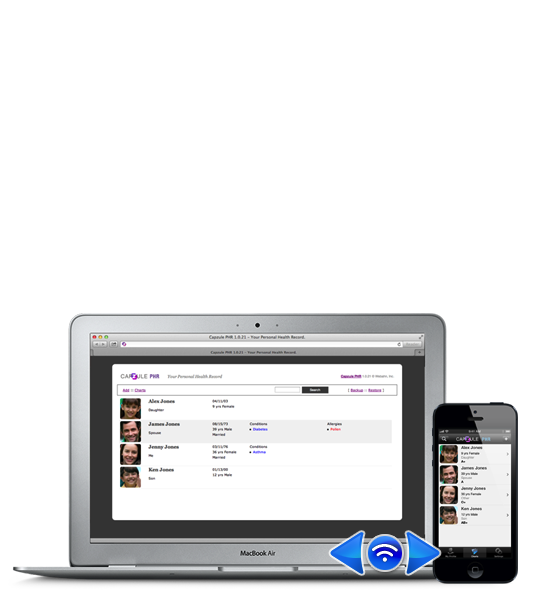
Can I Sync data between devices?
Core idea behind Capzule is to provide an Offline PHR where data is kept completely off the internet. So it doesn't offer any kind of automatic sync which requires the data to be stored online at some stage of such a transfer. However, Capzule provides tools to manually Copy or Merge selective data directly between devices.
In order for devices to discover each other over Wi-Fi
- Capzule must be enabled on device Settings / Privacy / Local Network
- Devices must be connnected to the same Wi-Fi
How do I add a family member?
From the Chart/Member Profile screen, select the plus icon in the upper right corner to add a family member.
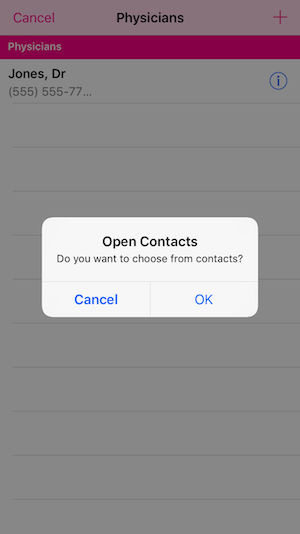
How do I enter a physician into the address listings?
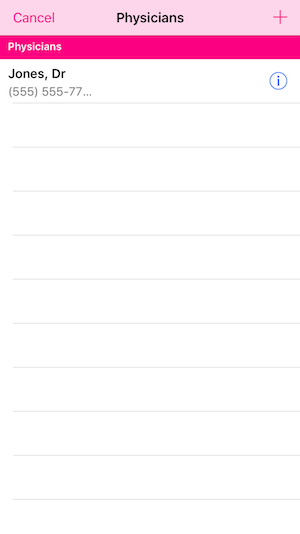
1. From the Settings menu, select the listing for Physicians. 2. Use the plus icon to add a listing. 3. A pop up option will appear to select from the contacts of your device if you prefer & to help save time. Enter information as needed, and select Save. NOTE: Physicians will be listed in alphabetical order by last name.
How do I enter my height and weight or vitals?
1. Select a Member/Chart from the Chart menu list. 2. Select the Graph tab from the list of tabs on the right. 3. Select the plus icon to the right of Vitals to open a new edit box. 4. Enter the information & select Save. The Profile (top) tab will reflect Vitals data from the most recent date.
Blood Pressure is entered in Systolic/Diastolic format, for example 120/80.
BMI (Body Mass Index) will be automatically calculated based on the height and weight you enter.
How do I set a chart to My Profile?
By default the first chart created will be assigned as the Profile Chart/My Profile. When entering or editing a new Member/Chart Profile, look for the Relation selection; the listing "Me" will set that person in the My Profile menu. Only one chart can be assigned as "Me" at a time. If another chart is already assigned as the Profile Chart, first you will have to change it in order to set a different chart to My Profile.
How do I view all entries for a given date?
Go to the chart's first tab, select Show All (below name, next to Timeline and Summary buttons). This will list entries sorted and grouped by date showing the most recent at the top.
How do I view similar flowsheet and screening entries together?
Select Show All of a particular section in Flowsheet or Self Screening
Select Type from List / Type switch at the top right
Select desired Flowsheet/Screening to view all entries for a given type
What actions can I do from my computer?
Upload Files
Print Summary
Edit/Add Entries
Take Backup
Restore Backup
What if I don't remember the start date?
If a start date is required, but you don't remember the beginning date, we suggest selecting an approximate year and month, then enter the 1st day of that month. In the notes section you may want to add that the date is an approximation.
Why are my weight and measurements wrong?
The default in settings for measurements is set for Metric. When the settings are set to metrics and 100 is entered upon the assumption that pounds are being entered, the person would then show they weigh 100kg. Upon changing the settings from metrics to US standard, 100 kg would be converted into 220 lb. To select your preference, select the settings menu at the bottom of the screen. Select Settings from the list menu, then turn Metric ON to use metric measurements, and OFF to use US standard measurements.
Why don't I see a QR code when I log into Capzule PHR?
From Settings menu select the listing Settings: Password Settings. Make sure the QR Code is turned ON, and if a password has not been set, be sure to create one. From here you can close Capzule PHR, and reopen the app to view the QR code. Select the QR symbol to open the data in plain text. Select the plain text to close the window.
Why don't you provide a database of common diagnoses, allergies, drugs, test results and vaccines?
Due to high overheads associated with managing huge lists for various regions in 12 languages that the app supports, we do not offer that option at this moment.
Please note that the test result samples and flowsheet templates provided with the app are meant to act as guidelines only.
Advanced Functions
Backup & Restore
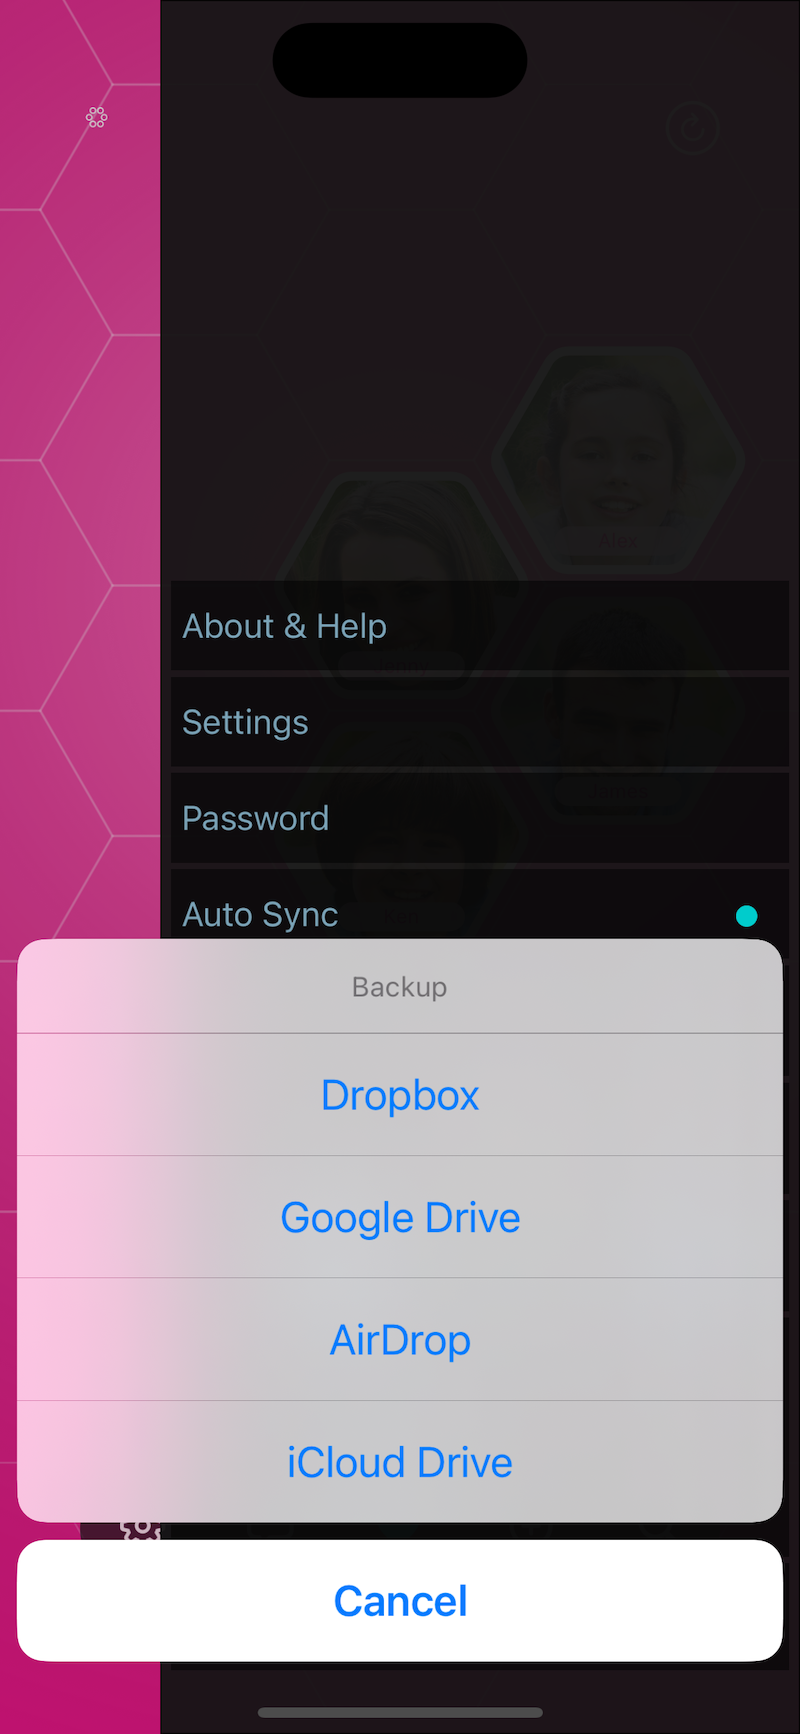
Save BackupThere are 3 ways you can make a backup. - Cloud: Select the cloud icon from Setting/Backup. Choose Dropbox, Google Drive or iCloud.
- Email: Select Email option from Settings/Backup.
- Computer: Select Settings/Share/Connect to Computer (first option), start web port, open link on a computer browser and click Backup option.
Restore- iCloud: Select Settings/Backup, choose iCloud, tap on backup file and follow the instructions.
- Dropbox/Google Drive: Open cloud service from Settings/Tools, navigate to folder, tap on download button.
- Email: Open backup file from Mail app in Capzule, follow restore instructions.
- Computer: Select Settings/Share/Connect to Computer (first option), start web port, open link on a computer browser and click Restore option. Select backup file from computer and follow instructions
Note: This is an OVERWRITE function; all data in your Capzule PHR app will be deleted and replaced with the data file from your backup file. Optionally you can select individual charts to be restored from a backup file.
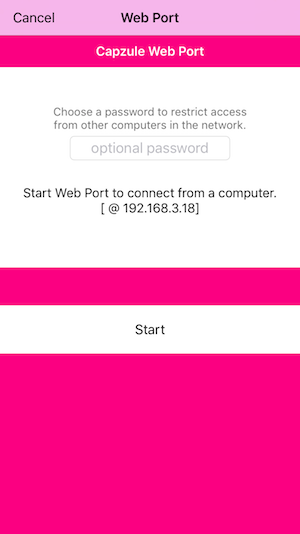
Connect from Computer
You will need to have both the device and your computer on the same Wi-Fi network to make this work: - From your computer open a web/browser page.
- Select Settings and choose the Connect from Computer (first icon) under Share.
- Enter a password (optional) in the text box and select Start.
- An address will appear beginning with http:// followed by a number sequence (IP Address). Enter the full address in the address bar of the browser on your computer.
- Once connected, you will have to enter the password if you have entered one while starting, to view and enter information.
NOTE: The device and computer must be on the same Wi-Fi network. - If you have a firewall setup please make sure ports 8080 through 8099 are allowed. - If the link presented shows "null" refer to Troubleshooting regarding this issue.
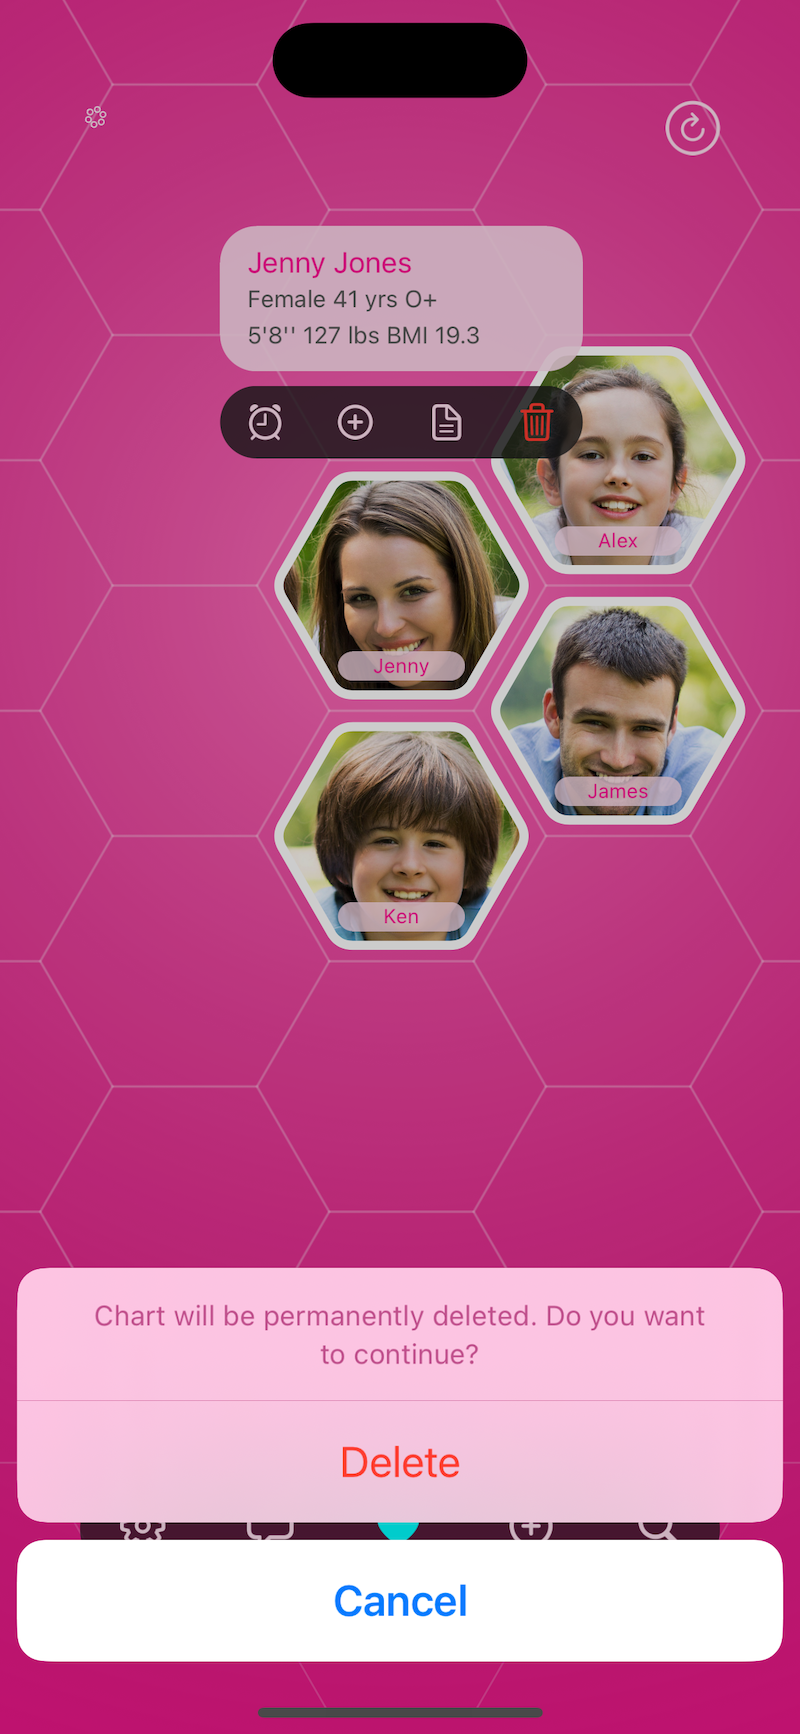
Delete
Delete Chart Select the trashcan icon on a profile when on tile view to delete a chart.
When working in a member/chart profile, select the action arrow button (arrow & box) in the upper right corner of the screen, select the delete button, & confirm in the pop up window.
Delete Data
From data item list swipe to reveal a delete option.
Entries can be deleted from edit page too. Scroll to the bottom of the edit page, slide the indicator next to "Delete This Record" to "ON" and select Update in the upper right corner of the screen to complete.
Email
1. Select the Summary option of a chart OR select the blue action button from a flowsheet (graph tab) or attachment (folder tab) listing. 2. Select the compose icon in the upper right corner to open the mail option 3. Select a format from the menu 4. Complete the email information and select Send to complete. Note: You will need to activate Mail on your iOS device to send an email.
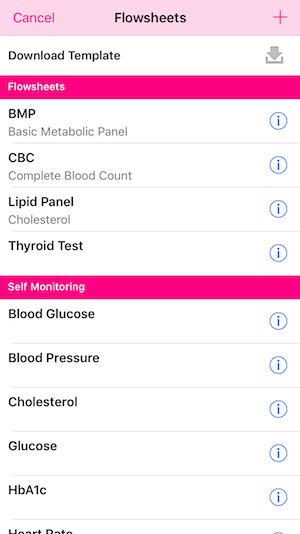
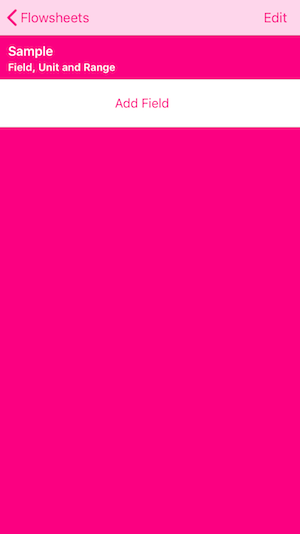
Flowsheets (Add or Edit)
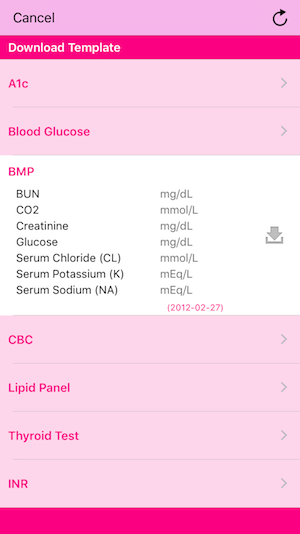
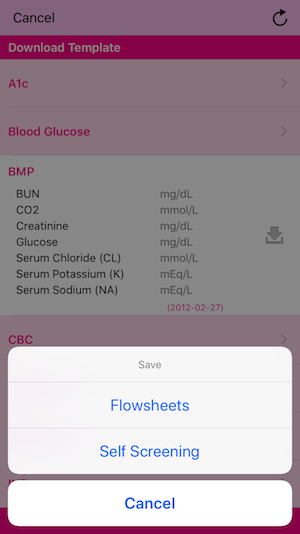
A set of flow sheets are included in your PHR. You may prefer to edit, or create your own templates. Additional templates are available to download as well as the original in the event they are needed in the future. To download templates: Select the Settings / Flowsheets.
Select the green download icon to open a list of flow sheets.
Select a listing to expand.
Select the green download button to initiate download.
Select whether to save as Flowsheet (usually reflects lab results from your doctor) or Self Screening (usually reflects data you track at home) to complete the import.
Select cancel to return to the list of flowsheets available to edit.
Select a member/profile chart and the graph tab to enter new data into a flow sheet.
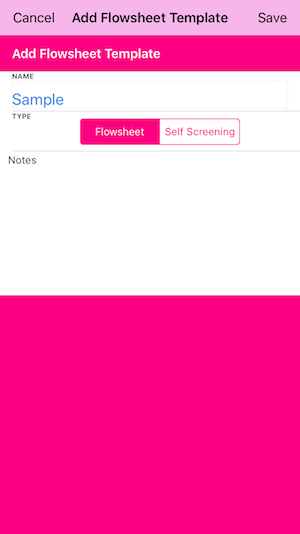
To edit or create new flow sheets to fit your needs:
1. Select Settings: Flowsheets
2. To create a new type of flowsheet, select the plus icon. Select a Name to identify the flow sheet, and select the Type you would like to create:
Flowsheet pertains to data related to lab tests
Self Monitoring refers to data you track on your own
3. Select Save, this will create a listing for the flow sheet that you will now need to edit.
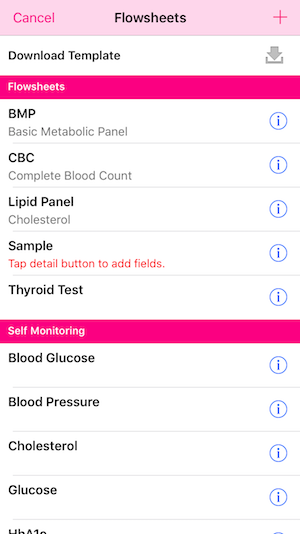
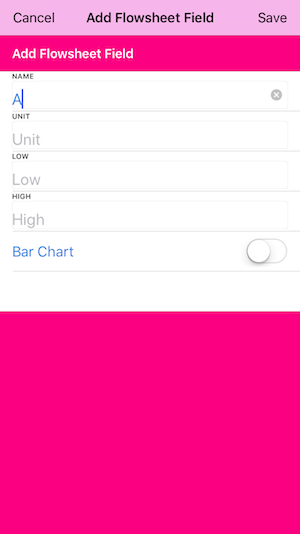
4. To edit an existing flowsheet, or create fields for a new flowsheet, select the blue arrow button.
5. A new screen will open; select a line item to edit a field, and the icon to create a new field.
Name will identify the type of information to be entered.
Unit refers to the measurement of the data such as cm/in, or mg/dL for example.
Low and High are guidelines for an entry, and are not mandatory.
When Bar Chart is selected ON, the values will be plotted as a bar graph instead of lines on an X & Y axis. This is most useful for viewing a one or two values over a week or monthly time period. This option can be turned on and off as needed going forward.
6. Select Save to complete the entry and to add a new Field entry.
NOTE: For more help see Frequently Asked Questions: Graph Tools & Notifications
Flowsheets (Download)
Select Settings/Flowsheet
Select Download Template
Select template, tap on blue button
Flowsheets (Set Bar Chart)
Edit Flowsheet template
Select Field
Set Barchart to ON position
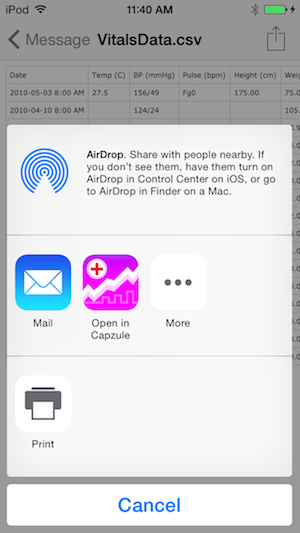
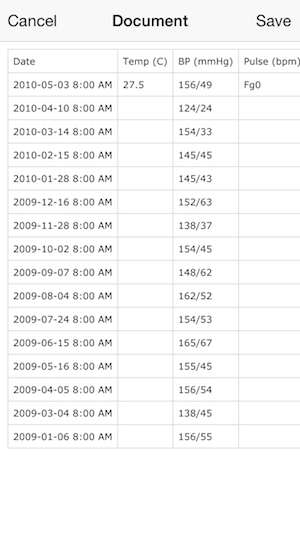
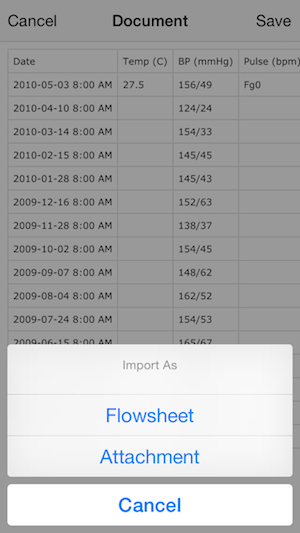
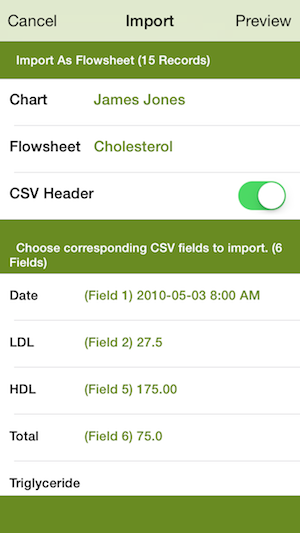
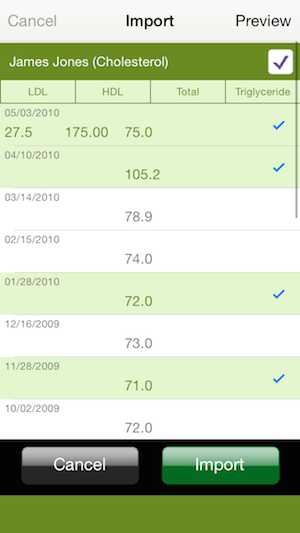
Import CSV Files
1. Open CSV file from Mail app attachments or other Apps in Capzule PHR. 2. Tap Save, select "Import As Flowsheet" option. 3. Select Chart and Flowsheet. (You may need to create a custom flow sheet, for more information see Getting Started: Set
Preferences: Create Flow Sheets) 4. Turn CSV Header ON if the file has header row. 5. For each Flowsheet field, choose corresponding CSV field. 6. Tap Preview to verify data. 7. Tap Import to save data. Note: The CSV file must contain a Date field, such as yyyy-mm-dd or mm/dd/yyy or dd/mm/yyy (depending on regional settings). Simple CSV format is required; feilds containing new line characters will not import.
See also Troubleshooting: Graph Tools & Notifications
Insert/Upload Mail Attachments
1. Open the email attachment from your email. 2. Use the arrow action button in the upper right corner to access menu options. 3. Select to open the file in Capzule PHR to activate the app. 4. Select Save from the pop up menu, and enter the required data; select Save to complete.
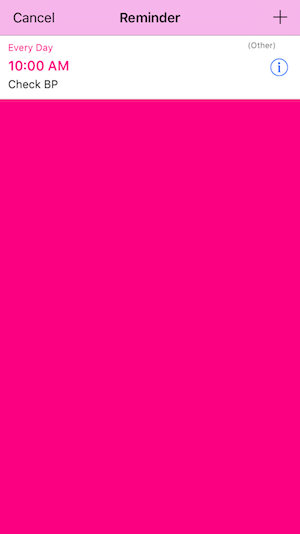
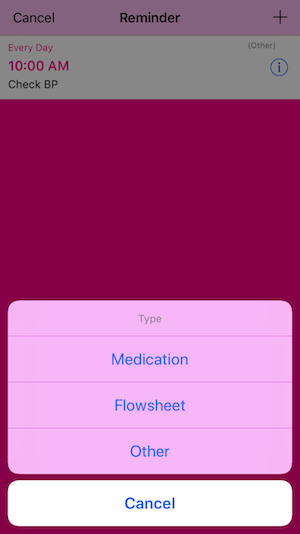
Medication Reminder
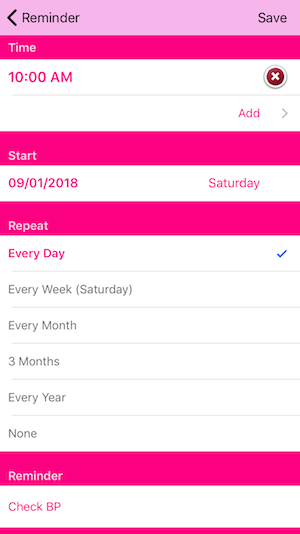
A medication reminder may be set for each chart/member, which will create a pop up alert on your iOS device at the selected time to take a medication. Medications must first be entered in the medication tab for each member/chart profile.- From the Profile tab, select the Reminder menu running along the top portion below that person's name.
- Select Add to create a new reminder
- Scroll towards the bottom to select medications, one or more may be selected to show a check mark next to it.
- Under the heading List, select Show Medications in Alert Message if you would like the pop up reminder to include the name of the medication (a check mark will appear)
- Under the heading Time, select Add to create a new time to be reminded, then select Save. Additional times may be entered by selecting Add, and unneeded entries may be deleted using the red X.
- Select a Start Date.
- Select an interval, either daily, weekly, monthly, yearly under the heading Repeat (a check mark will appear next to the selection).
- Select Save to begin.
- Create a new reminder for additional medications by selecting the button in the upper right corner.
- Delete an entry by selecting the Blue Arrow button in line with the entry. Select Delete from the pop up menu.
Print
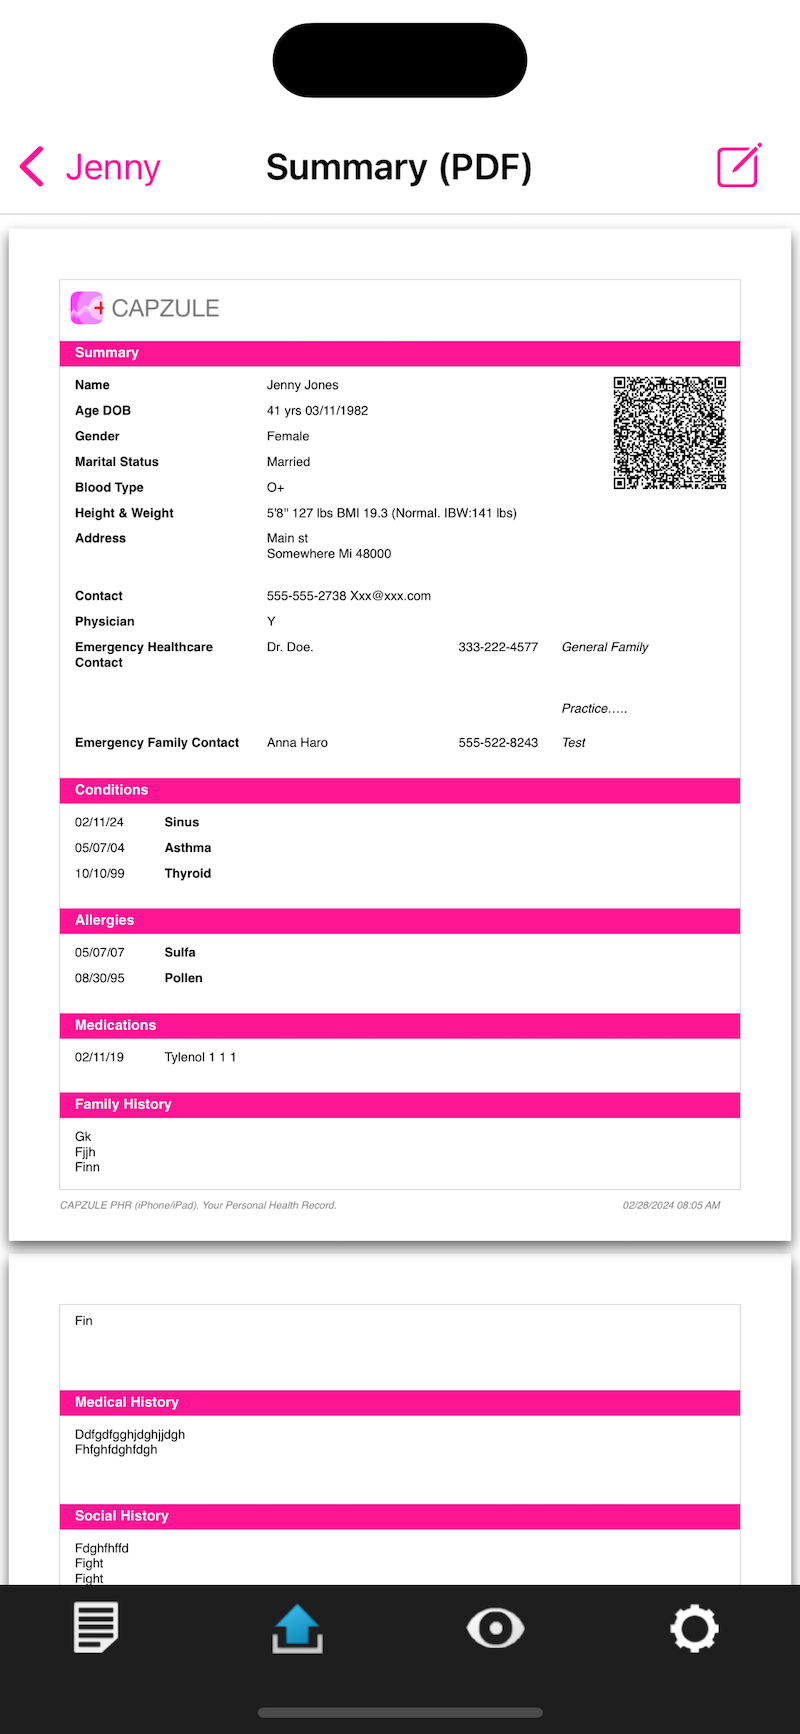
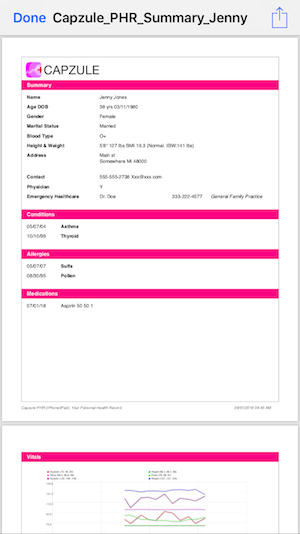
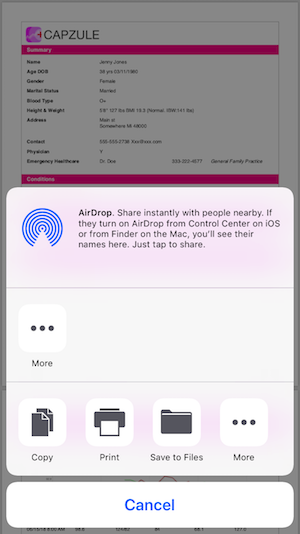
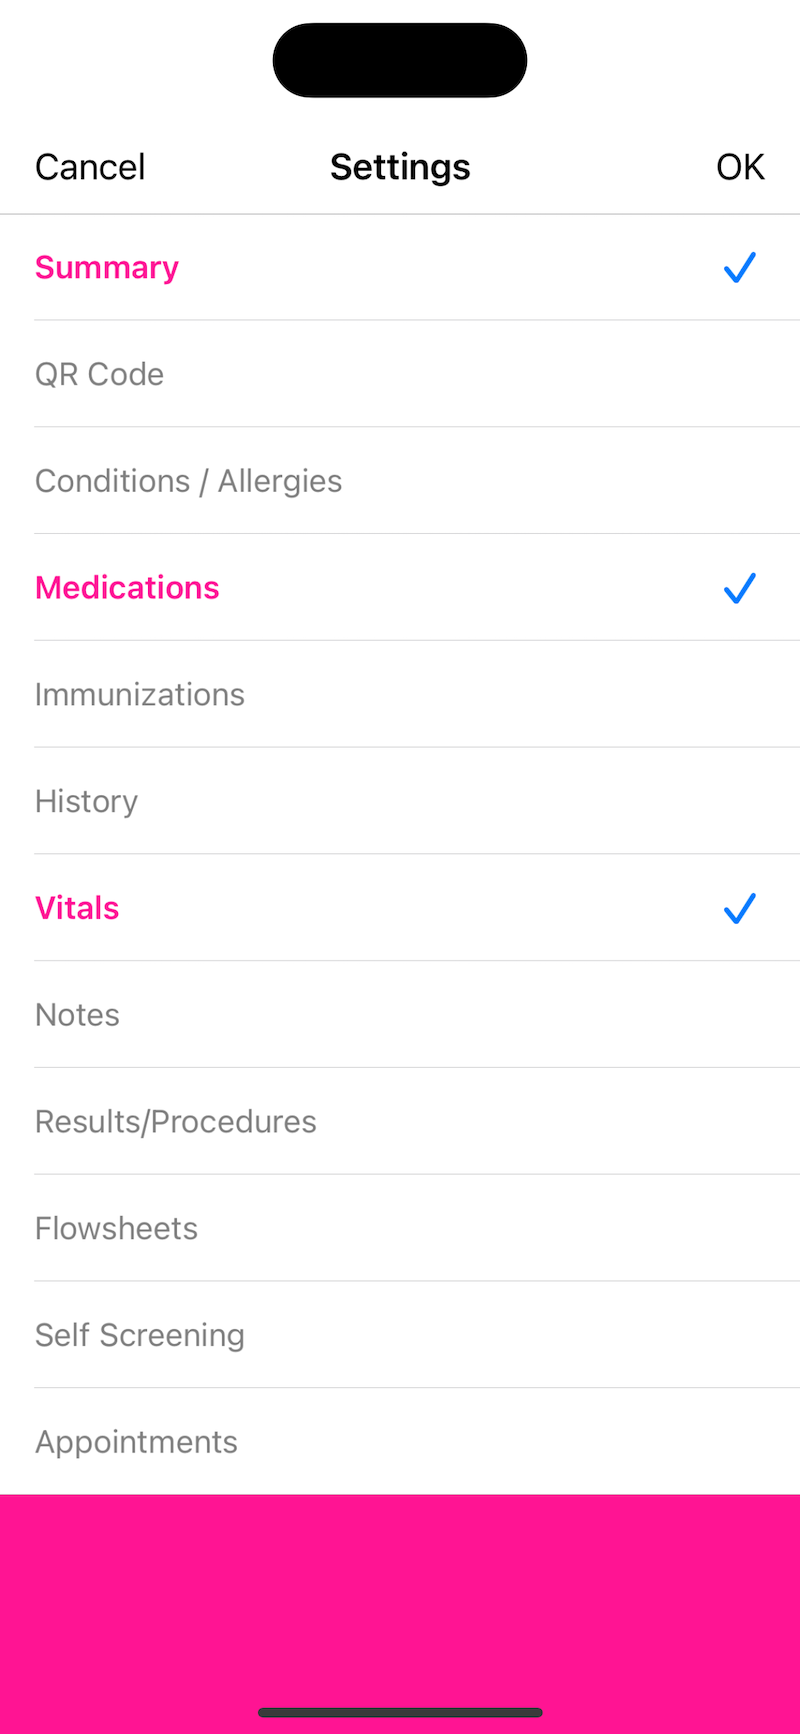
1. Select a member/chart profile that you would like to print. 2. From upper right corner select the arrow action button to open a menu, and select Summary (PDF). 3. Select the action arrow button in the upper right corner to open the print menu, which will send the document to your iOS compatable printer. NOTE: Information listed can be edited to include/exclude categories by selecting "Summary" (without PDF) from the menu & using the Gears icon to open the options menu.
QR Codes
The QR function provides a summary of data that can be passed to to another device that reads QR codes. This is useful for quickly passing on data for emergency purposes.
1. Select the Chart menu button twice, then select a member/chart profile
2. Select the QR symbol to the right of the chart profile (this is a generic display and does not contain data).
3. Select OK to Refresh QR Data
4. A summary of information will appear. Note that a name is not connected to the data for privacy reasons. If you would like to include a name or other information tap on QR Data, use the keyboard to edit.
5. Read through the remaining information, and delete anything that you do not want displayed, then select OK.
6. A pop up box will appear to alert you that the data will be sent to an outside website to create the QR code. Capzule PHR uses a secure (https) connection to connect to Google Chart API. If you are concerned about privacy, please visit the Google Chart Tools: http://code.google.com/apis/chart/interactive/terms.html
7. Select OK to continue creating a QR code, or select Cancel to discontinue the process.
8. Select OK on the next pop up screen to finalize the new QR code.
To display the QR code for that chart/member, select the QR icon next to the profile data. an option to email the QR code is also availble here.
QR codes can be generated for the owner of the PHR and displayed at the login for emergency personnel to access. To do this, open the Password Settings, and move the slider for "QR Code" to ON & select Save. Make sure a QR code has been created for the "Me" profile as described above.
NOTE: You will need to create a new QR code should significant information change in your emergency medical profile. To do so:
1. Return to the My profile in the Chart, and select the QR code.
2. Follow the prompts to refresh then edit text data.
3. Select the QR code to open the refresh code box, and follow the prompts.
4. For additional options, use the action button in the upper right corner of the pop up box.
How to display only Text on login screen:
If you wish to display only the text, go to the Me profile in Chart, and select the QR symbol again. Select the Action button, and select delete. Then select Refresh Summary from the action menu, edit if required and then select Update from the action menu (skip QR code generation process).
How to display only the QR code on login screen:
If you do not want plain text to appear along with the QR code, return to the Me profile in Chart, and select the QR symbol again. Select the text data, and delete out the information, then select OK. Use the action button in the upper right corner of the pop up box to open a menu and select Update. In this case, emergency responders will need a QR scanner/reader to view the information on the log in page.
How to display QR codes in the PDF Summary:
1. Select the Summary option from the Profile tab in a member/chart profile, or select the Arrow action button in the upper right corner and select Summary.
2. Select the Gear icon in the upper right corner, and click on QR Code so that a check mark appears next to it.
3. Select OK
4. Return to the chart/member profile and select the Arrow action button in the upper right corner.
5. Select the Summary (PDF) listing to view.
- See also Frequently Asked Questions: QR codes
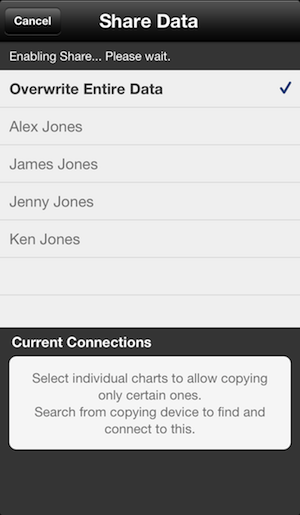
Share Between Devices
You will need a WiFi connection to make this work: From the settings menu select Share Data.
The person sending data should select Share From This Device.
The person receiving data, should select Copy From Another Device.
The person Sharing should initiate the process, selecting Share From This Device, then Start Sharing.
The person Copying will enter the last three digits of the IP address shown on the Sharing device into the box provided. If no IP address is entered, the Copying device can do a search, however it often takes considerable time for devices to find each other.
A message will appear on the device Copying data when a connection has been made.
Allow permission to copy on Sharing device and then choose Copy Data on Copying device
Note: Sharing will OVERWRITE the information entered in the device receiving data.
This function is best used to set up another iOS device that your family utilizes, or to send updated information for one member/chart profile at a time when new information has been entered for that person.
The device and computer must be on the same Wi-Fi network.
If you have a firewall setup please make sure ports 8080 through 8099 are allowed.
If the link presented shows "null" refer to Troubleshooting regarding this issue.
- See also Troubleshooting: Connect to Another Device
Troubleshooting
Connect from Computer
Why can't I see the data from the app on my computer?
Note that the address displayed from the app to enter into your browser will be similar to http://123.456.7.890:8081 - the last separating character is a colon ( : ), if a period ( . ) is entered before the numbers 8081, the browser page will display an error message.
Make sure that your device and computer are on the same Wi-Fi network.
If you have a firewall setup, please make sure ports 8080 through 8099 are allowed
If the link presented from the app shows "null", the IP address is not available for the device, check the Wi-Fi connection and the Settings of your iOS device to make sure the network is established.
Why can't I connect to my computer?
Make sure a WiFi connection is available. If the device will not connect to the WiFi, turn off your device and turn it back on.
NOTE: Certain 3G Wi-Fi devices after iOS 4.3.1 upgrade fail to detect device IP address. In order to fix this issue, reset the network settings at Settings > General > Reset > Reset Network Settings and connect to network again.
Graph Tools & Notifications
Flowsheets will help track information from clinics such as CBC or Lipid Panel (cholesterol), while Self Monitoring will help you track data from outside the clinic such as blood sugar counts or other observations. For example, you could create a Self Monitoring template to enter daily food intake, running distance and calories burned that will produce a log like below. | Date | Intake
(cal) | Burn
(cal) | Distance
(miles) |
|---|
| 01/05/2011 | 1800 | 600 | 3 | | 01/04/2011 | 2200 | 800 | 4 | | 01/03/2011 | 2000 | 800 | 4 |
In order to get such a log you need to create a Self Monitoring template in the Settings page called My Run Log and add 3 fields. Field named Intake with unit called cal.
Field named Burn with unit called cal.
Field named Distance with unit called miles.
Note: You do not need to create a field for Date.
You could create any number of templates with any number of fields.
Once a template is created, from the Chart menu you can go to the Flowsheet/Self Monitoring tab, select the plus icon and select the template My Run Log to enter data for a particular date.
How do I view similar flowsheet and screening entries together?
Select Show All of a particular section in Flowsheet or Self Screening
Select Type from List / Type switch at the top right
Select desired Flowsheet/Screening to view all entries for a given type
How do I import a CSV file to Flowsheet?
Simple CSV format is allowed (Fields containing new line characters will not work).
CSV must have a Date field. Supports yyyy-mm-dd and mm/dd/yyyy (or dd/mm/yyyy depending on regional setting) formats.
Open CSV file from Mail app attachments or other Apps in Capzule PHR
Tap Save, select "Import As Flowsheet" option
Select Chart and Flowsheet
Turn CSV Header ON if the file has header row
For each Flowsheet field, choose corresponding CSV field
Tap Preview to verify data
Tap Import to save data
How do I view my flow sheet results in a bar graph?
Open the Settings menu at the bottom right of the screen, then select Flowsheets. Select the Blue Arrow button in line with the flow sheet you would like to select. Select a listed field to open the edit option, and slide the indicator next to Bar Chart to ON. Select Update to complete.
Share
Why does it show (null) in place of IP address?
Certain 3G Wi-Fi devices after iOS 4.3.1 upgrade fail to detect device IP address. In order to fix this issue, reset the network settings at Settings > General > Reset > Reset Network Settings and connect to network again.
Why won't the sharing work?
Make sure a WiFi connection is available. If the device will not connect to the WiFi, turn off your device and turn it back on. Sharing will not work unless both devices show they are connected.
Device IP address detection.
Certain 3G Wi-Fi devices after iOS 4.3.1 upgrade fail to detect device IP address. In order to fix this issue, reset the network settings at Settings > General > Reset > Reset Network Settings and connect to network again.
Both Devices Must Be On the Same Wi-Fi.
To check IP addresses of devices, start Web Port on both devices using Connect from PC option. The IP addresses presented to connect must have the first 3 numbers the same.
For example; device A "http://123.456.789.1:8081" and device B "http://123.456.789.2:8081".
Wi-Fi Router Ports 8090 to 8099 must be allowed.
App uses a port between 8090 and 8099 to connect and share. If your Wi-Fi router is set up to block any of these ports, allow it in router and restart the app.
IP Address and Scanning
App may take more time to find another device if IP addresses are far from each other.
For example, searching from device with 123.456.789.1 to find device at 123.456.789.50 will take longer than to find at 123.456.789.5. You could manually set nearby IP addresses on devices to make the process faster.
NOTE: Certain 3G Wi-Fi devices after iOS 4.3.1 upgrade fail to detect device IP address. In order to fix this issue, reset the network settings at Settings > General > Reset > Reset Network Settings and connect to network again.
Hints & Tips
Chart/Member Profile
Select a member/chart profile to view that person's data. The page will land on the profile tab.
Upload a photo by selecting the picture
Adjust the date of birth, and age by selecting the information to the right of the photo
The most recent vitals, and calculated BMI will also appear to the right of the photo
Above the profile information, a set of shortcuts are available: Timeline, Show All and Summary
Below the profile information, a graph of recent information may be viewed. Select the graph to view in full screen mode. Use the Settings: Settings: Graph Chart to select which graph should show by default below a profile.
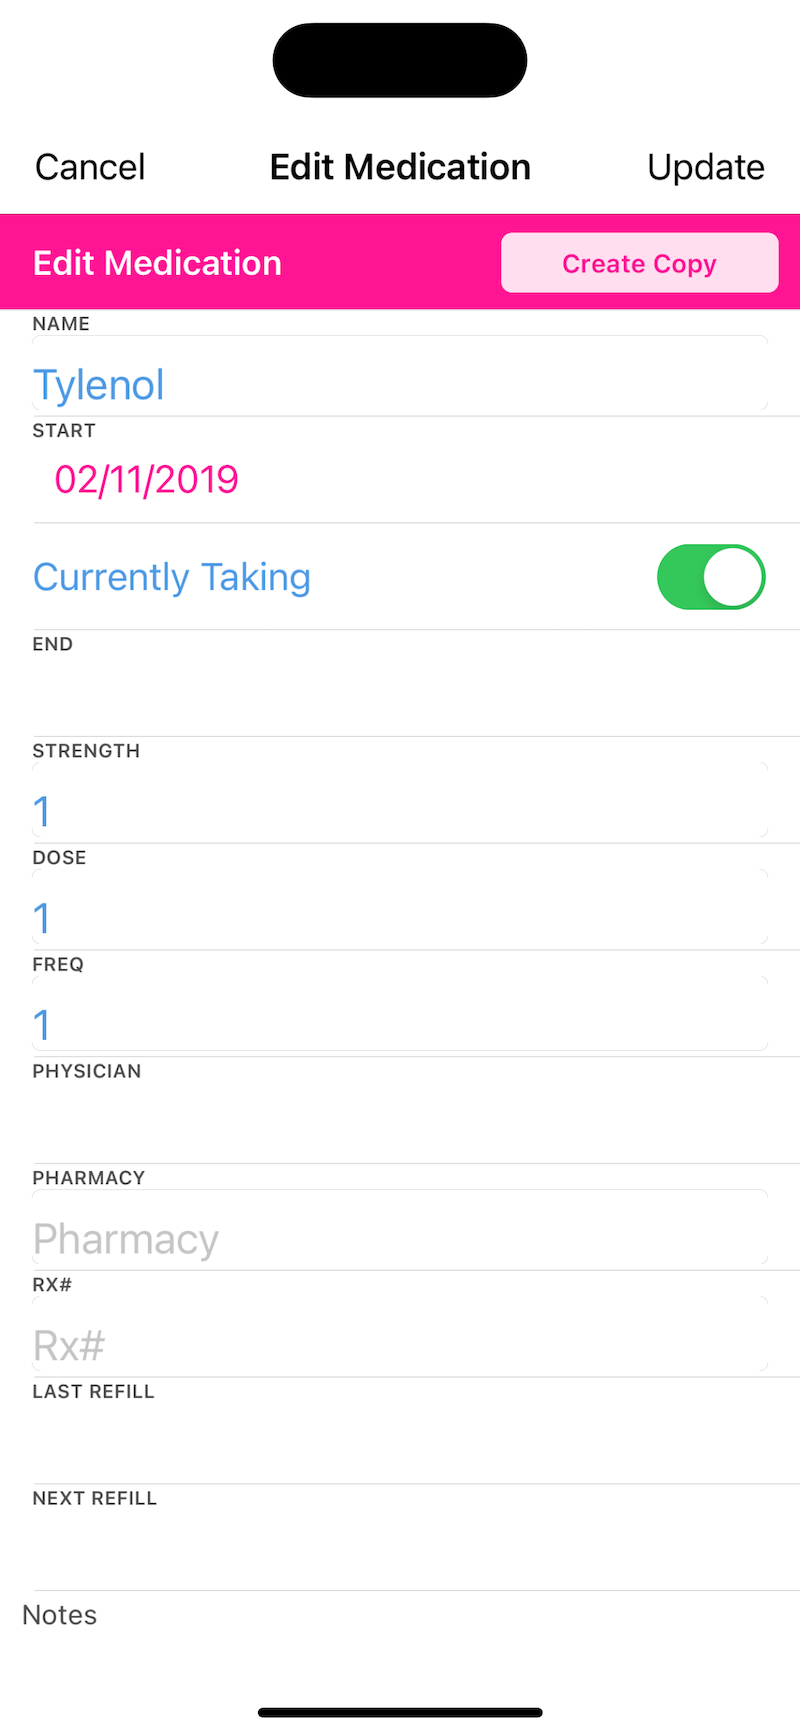
Create Copy
When in the edit mode for most listings, the option to Create Copy will appear. This will duplicate the entry, allowing you to enter a new date, and adjust the information as needed. This is useful when entering flow sheet data often, or when scheduling a follow up appointment with a physician.
Customize Graph Views
Use the Settings menu, then select the Settings listing to open the custom graph options. Here you can select:
The default graph that should appear below a member/chart profile
The period of time that graphs should default to, such as 1 year, or 6 months
The display of the plot points in a graph
Whether the low, high, and average readings should be listed at the top of a graph
Select a Bar Graph view by opening the Settings: Flowsheet menu. Select a flow sheet and edit the field values by selecting ON for the Bar Chart option.
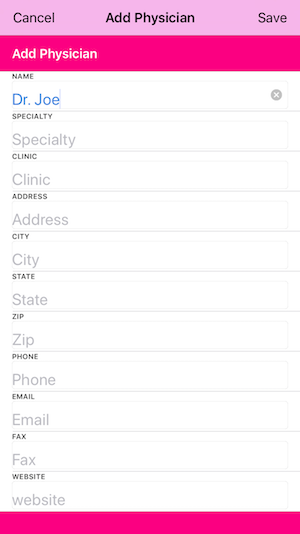
Enter Physician
Physician information can be entered from the Settings menu, or when entering data such as Medications, by selecting the Physician listing. Select the plus icon to add a new physician.
A pop up will appear to select from the Contacts in your iOS device. Select Cancel to type manually, or OK to browse your contacts.
Enter the physician name in the format: First Last, such as John Smith MD - It will appear in the physician address book as Smith MD, John. Don't forget to Save.
When entering a new physician from a category such as a new Medication, be sure to search for the new physician once it is saved. Select the physician to be returned to the Medication entry box.
Folder Categories
The Categories option when creating an entry in the Folder tab helps organize notes & files into groups. By default the Category is field shows None, but you may choose to rename this to anything you like such as, Lab Results, Questions, Physician Letters, etc.When more than 3 (iPod/iPhone) or 5 (iPad) listings appear under a main heading, the option to Show All will appear. Select this To view all listings for this heading.
Narrow the search by selecting Types in the upper right corner, which will display the Categories you have created and the number of files in that category.
Select a listing to view all files in that category, or select List in the upper right to view all again.
Search
From the Chart menu list, A search icon is provided in the upper left corner to help locate member/chart profiles by the first letters of the first or last name. This is useful when a large number of people have been entered. You can also select this icon twice to refresh the image list and return to the top.
Show All
The Show All option helps view a complete list of all entries in a member/chart profile, with oldest entries at the bottom, and newest entries at the top.
1. From the member/chart profile select the arrow action button in the upper right corner.
2. Select Show All from the pop up menu.
3. Select a listing to view more details
When viewing a listing, an option to Create Copy will appear in the upper right. This is useful for duplicating the information. The date will have to be filled in new, and to adjust any data, select that field. Don't forget to select Save.
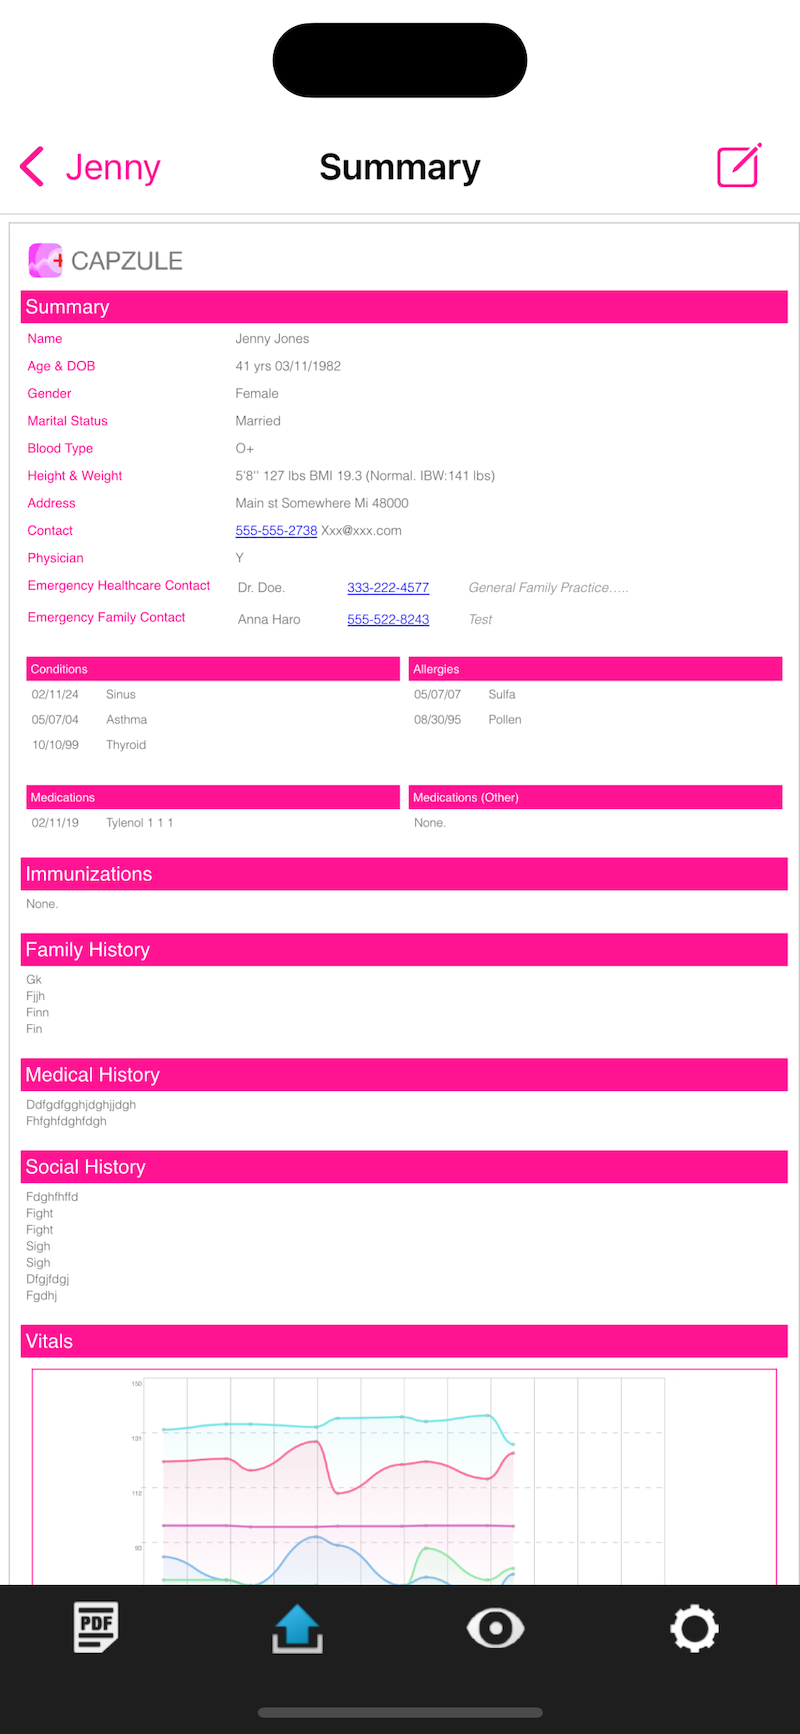
Summary
The Summary will help view the selected member/chart profile information as one complete page. What type of information to display can be selected, and emailed or printed. 1. From the member/chart profile select the arrow action button in the upper right corner. 2. Select Summary from the pop up menu. 3. Select the gears icon in the upper right portion to include/exclude information in the summary & select OK. 4. Select the paper and pencil icon to open the mail option. The Summary (PDF) option from the action menu in the upper right corner will help print. Use the main Summary & the Gears icon (described above) to adjust the information fields that will appear in this view. 1. From the member/chart profile select the arrow action button in the upper right corner. 2. Select the Summary (PDF) from the pop up menu. 3. Select the arrow action button in the upper right corner of the PDF view for print options.
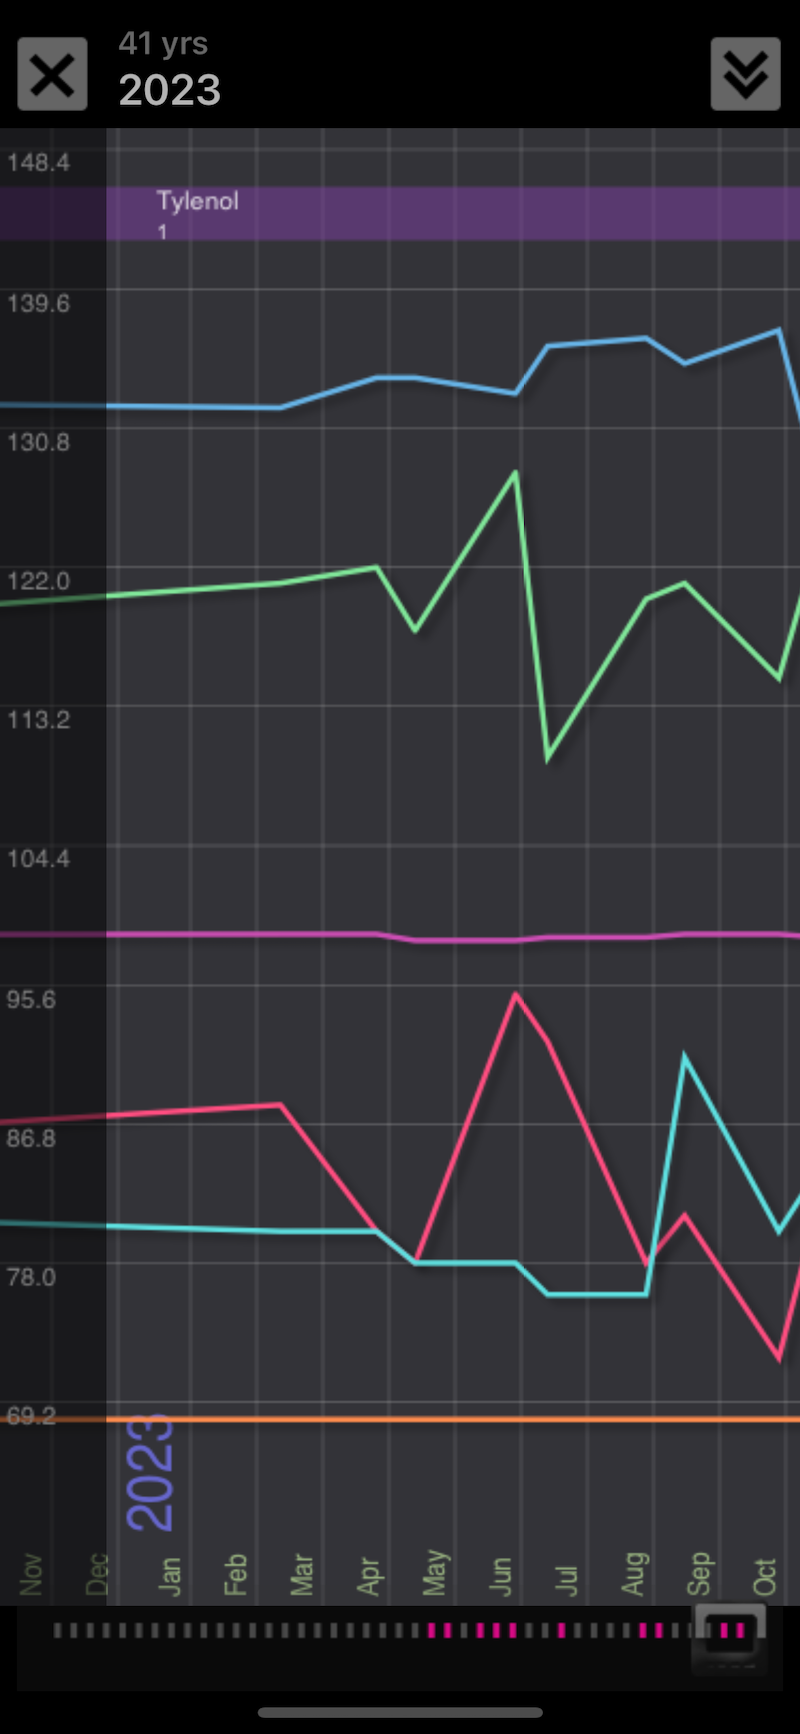
Timeline
The Timeline will provide a graph view of all information in a member/chart profile. This can be useful for identifying trends, or looking over a long length of time. 1. From the member/chart profile select the arrow action button in the upper right corner. 2. Select Timeline from the pop up menu. 3. Select the double arrows in the upper right corner to select categories & data to include/exclude in the timeline graph.
|